Master the Art of Timing Your Entry
In the fast-paced world of trading, timing is everything. Whether you’re buying a stock, crypto, forex pair, or commodity, the difference between a good entry and a poor one often comes down to a few candles on your chart.
Candlestick patterns are not just price markers—they’re a visual representation of market psychology. Every wick and body tells a story of buyers and sellers in action, and when interpreted correctly, they give us precise signals on when to enter the market with high confidence.
🔍 Before You Buy: The Three Pillars of a High-Probability Entry.
Before acting on any candlestick signal, smart traders align three key factors:
1. Support Level (The Battlefield)
- This is the price area where buyers historically defend the asset.
- Can be a previous swing low, demand zone, Fibonacci retracement level, or trendline.
2. Reversal Candlestick (The Message)
- This is the signal that the selling momentum is weakening and buyers are stepping in.
- Look for well-defined patterns like the hammer, bullish engulfing, or morning star.
3. Volume Confirmation (The Backup Troops)
- Rising volume during the reversal pattern increases its credibility.
- It shows you that real interest is returning at this level.
When all three align, you’re no longer guessing—you’re executing a calculated, probability-driven trade.
🔝 Top Bullish Candlestick Patterns to Master
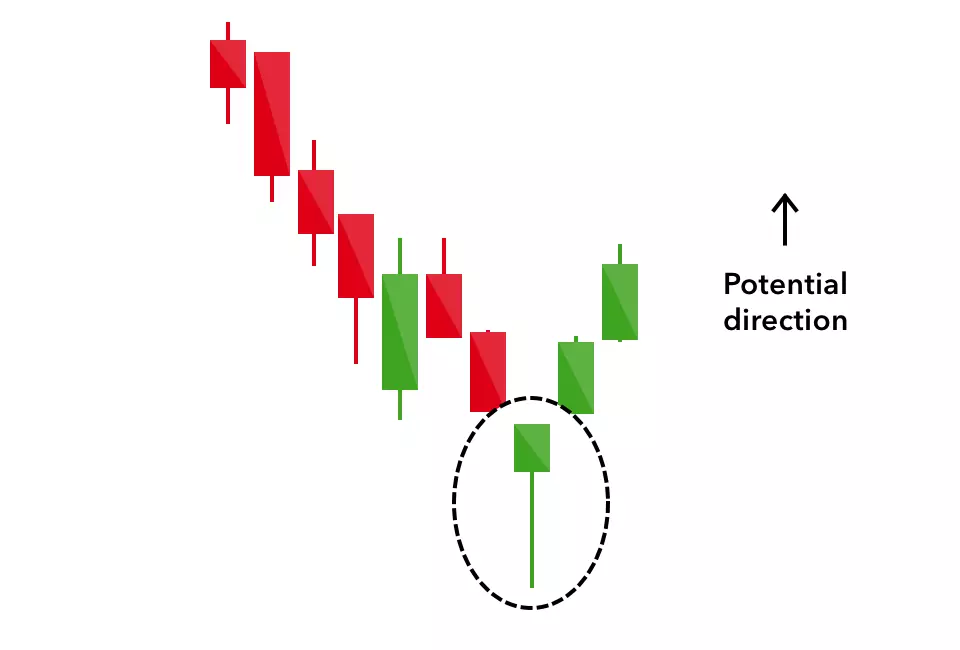
✅ 1. Hammer
- Visual: Small body at the top, long lower wick (at least 2x the body).
- Psychology: Bears tried to push the price lower, but buyers overwhelmed them by the close.
- Best Used: At the end of a downtrend or near a key support zone.
- Entry Rule: Wait for the next candle to break and close above the hammer’s high. Set your stop-loss below the wick.
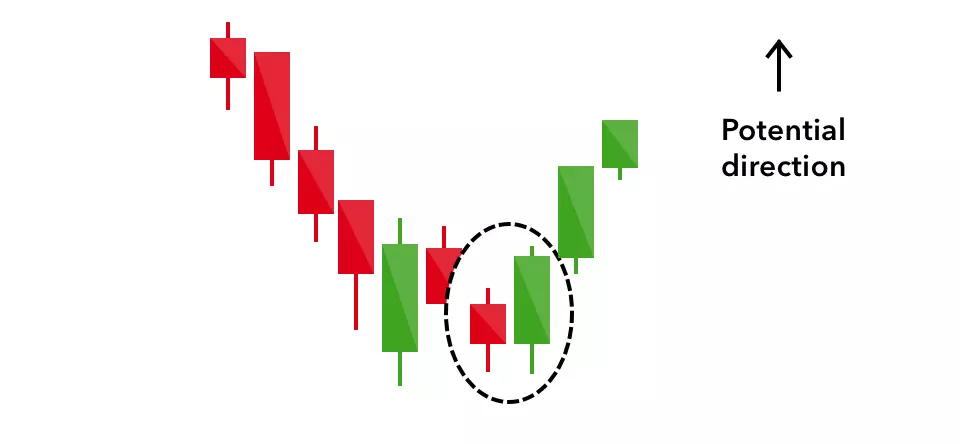
✅ 2. Bullish Engulfing
- Visual: Small red candle followed by a large green candle that completely engulfs it.
- Psychology: Bears were in control, but buyers came in strong and reversed the session.
- Best Used: At support or during a pullback in an uptrend.
- Entry Rule: Enter on candle close or on a break above the green candle’s high. Set your stop below the low of both candles.
✅ 3. Morning Star
- Visual: Three candles—(1) large red, (2) small-bodied candle (often a doji), and (3) large green candle.
- Psychology: Sellers control day 1, indecision on day 2, buyers dominate day 3. A full power shift.
- Best Used: After extended downtrends, often near strong demand zones.
- Entry Rule: Enter after the third candle closes bullish. Confirmation is critical.
✅ 4. Doji at Support
- Visual: A candle with nearly equal open and close, often with wicks on both sides.
- Psychology: Market is undecided. Selling pressure is losing steam.
- Best Used: When forming directly on or near known support.
- Entry Rule: Wait for a bullish candle to follow—this confirms buyers are stepping in.
🔻 Bearish Candlestick Patterns – Know When NOT to Buy (Or to Sell Instead)
Just as some candlestick patterns signal a buying opportunity, others shout “Caution!” or even suggest it’s time to sell or short. Recognizing bearish reversal patterns can save you from entering at the top—and help you profit when markets turn south.
Here are the key bearish patterns to watch for:
✅ 1. Shooting Star
- Visual: Small body at the bottom, long upper wick (2x or more the body).
- Found At: The top of an uptrend or resistance.
- What It Means: Buyers pushed the price up, but sellers took control before the candle closed.
- Use: Short or exit long if the next candle breaks below the shooting star’s low.
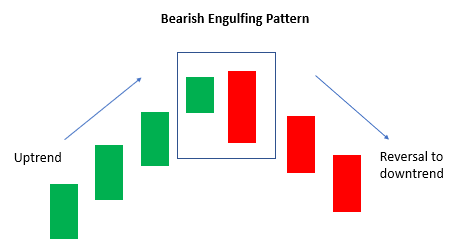
✅ 2. Bearish Engulfing
- Visual: Small green candle followed by a large red candle that completely engulfs the prior green one.
- Found At: The top of an uptrend or during a pullback in a downtrend.
- What It Means: Buyers were active, but sellers overwhelmed them with strength.
- Use: Enter short after the red candle closes or on a breakdown below its low.
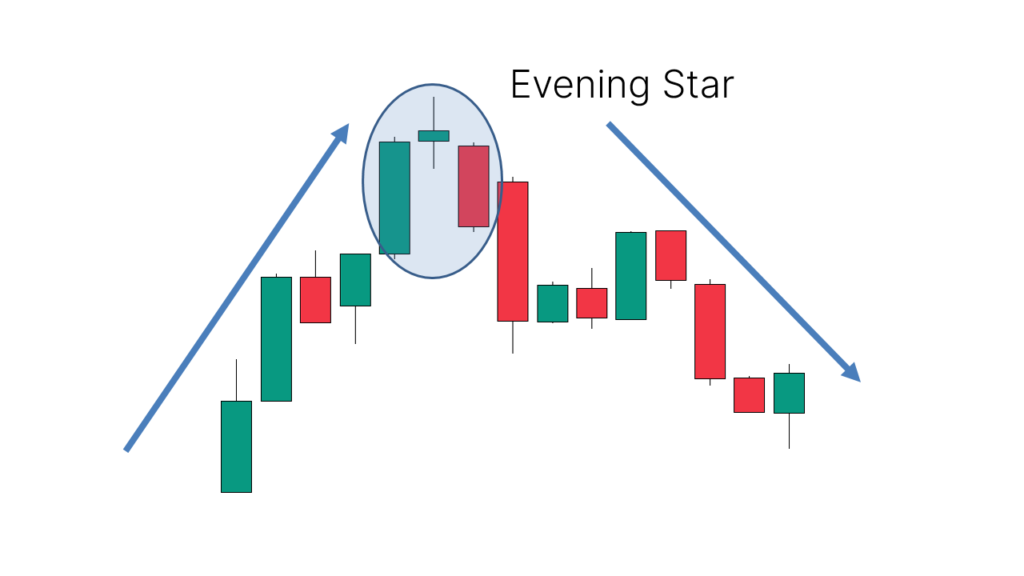
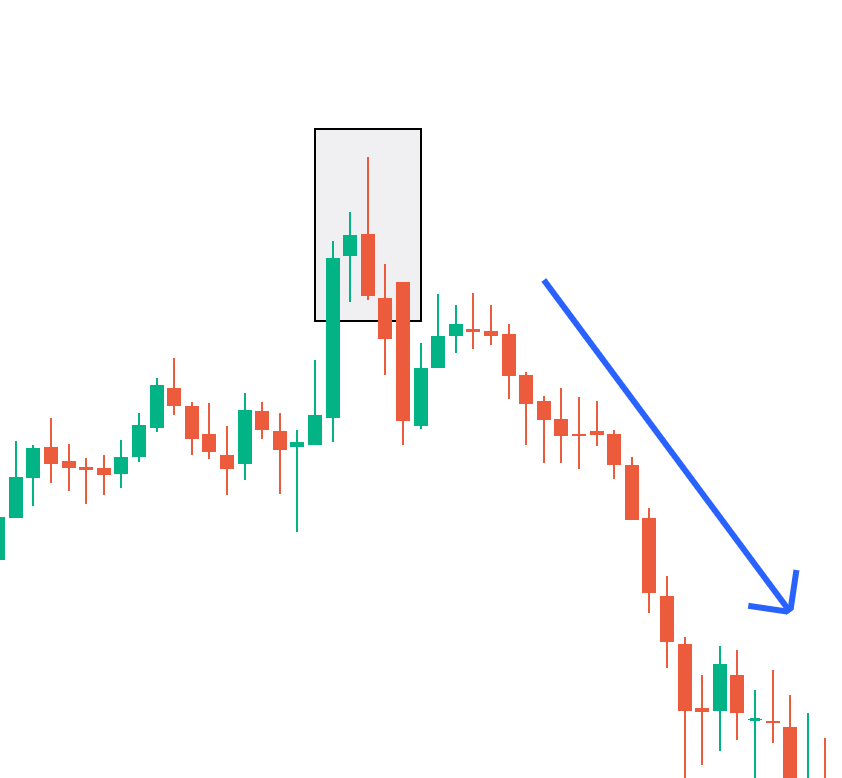
✅ 3. Evening Star
- Visual: Three candles – strong green, small-bodied candle (or doji), followed by a strong red.
- Found At: Market tops or resistance zones.
- What It Means: Buyers lose steam, uncertainty follows, and sellers seize control.
- Use: Short on confirmation after the third candle. Set stop-loss above its high.
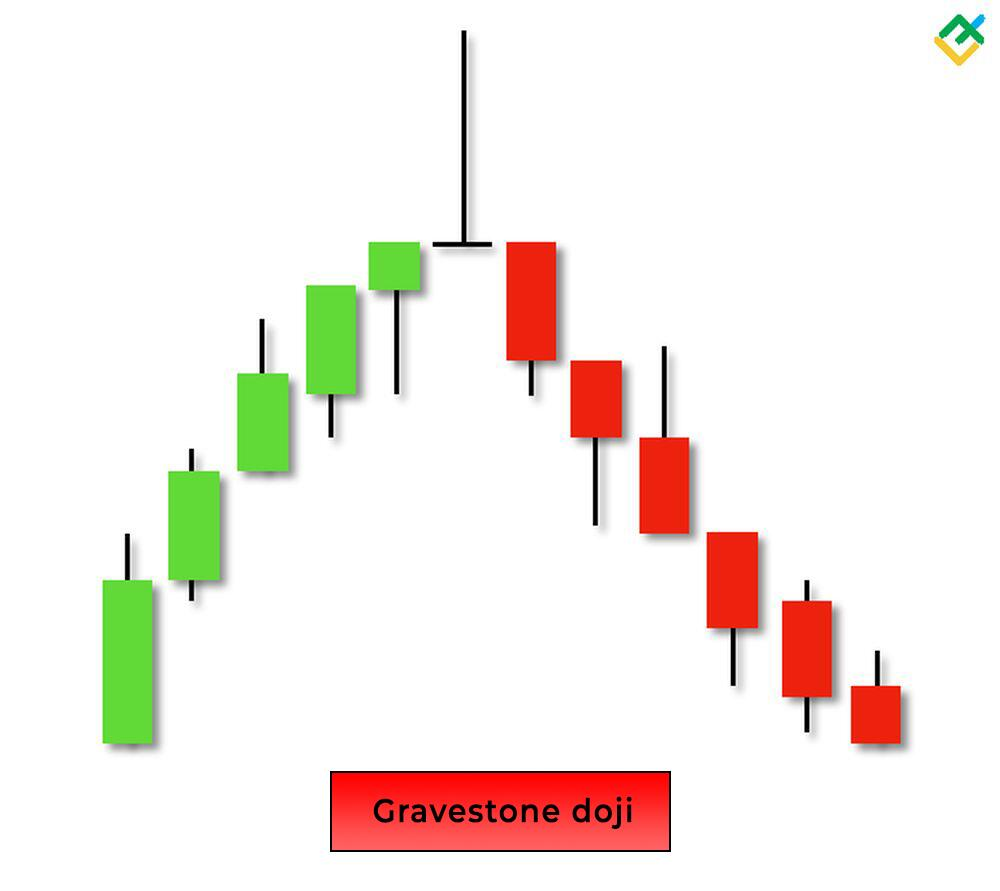
✅ 4. Gravestone Doji
- Visual: A doji with a long upper wick and little or no lower shadow.
- Found At: Resistance or after strong upward moves.
- What It Means: Price was pushed up aggressively, but sellers completely rejected it.
- Use: Confirm with a red candle after. It often signals sharp rejections.
🔥 Pro Tip:
If you see these bearish signals forming at a known resistance level, after a strong move up, and volume increases on the bearish candle—that’s not the time to buy. In fact, it may be the perfect time to reduce exposure or prepare for a short opportunity.
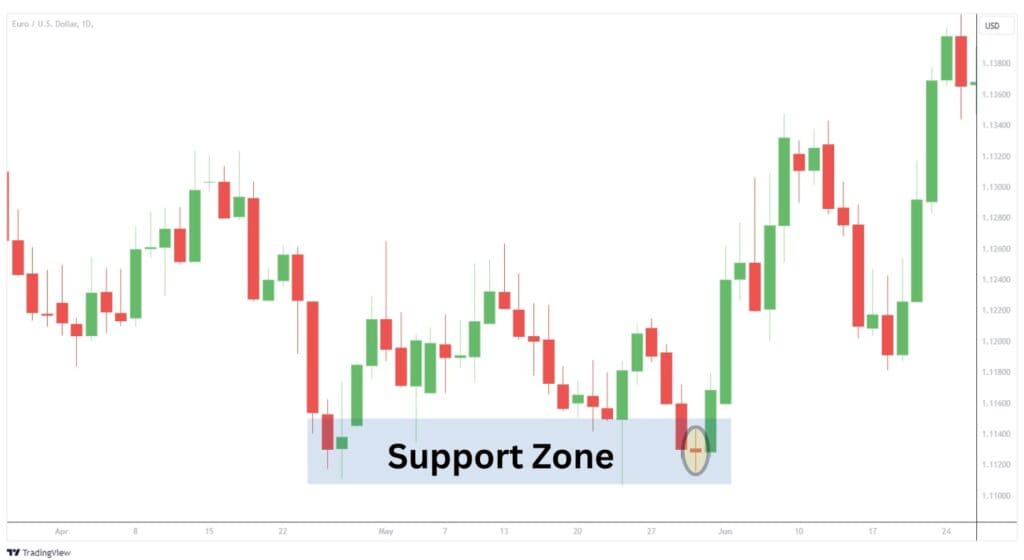
📌 High-Probability Entry Example
Let’s say you’re watching a stock in a downtrend. It approaches a major horizontal support level that has held multiple times in the past. You zoom in and see a hammer candle form with a strong lower wick.
You don’t buy immediately.
You wait.
The next candle opens and closes bullish, breaking the hammer’s high. Volume ticks up.
That’s your entry.
- Stop-loss: Just below the hammer’s low.
- Target: Based on the next resistance or Fibonacci extension.
You’ve just combined technical context, price action, and confirmation into one strategic move.
⏰ Best Timeframes for Reliable Signals
Candlestick signals work on all timeframes, but their reliability increases as you move higher.
| Style | Recommended Timeframes |
|---|---|
| Scalping | 1-min, 5-min (use with caution) |
| Day Trading | 15-min, 30-min, 1-hour |
| Swing Trading | 4-hour, Daily |
| Position | Daily, Weekly |
Tip: The 4H and Daily charts often produce the cleanest, most trustworthy candlestick setups.
🧠 Pro Tips for Smarter Candlestick Trading
- Never trade patterns in isolation — always align them with structure (support/resistance, trendlines).
- Use volume and momentum indicators (like RSI or MACD) for confirmation.
- Avoid signals in the middle of a trend — focus on potential turning points.
- Don’t chase the candle — wait for close and confirmation before entry.
- Use risk management always — protect your capital with stop-loss orders.
🎯 Final Thoughts: Buy with Confidence, Not Emotion
Mastering candlestick patterns is not about memorizing shapes. It’s about understanding market psychology and combining that with context, discipline, and confirmation.
You don’t need a cluttered chart or 10 indicators. What you need is clarity:
- Where is support or resistance ?
- What are the candles telling me?
- Is this a battle buyers are winning?
Answer those, and your entries will become smarter, cleaner, and more profitable.
👉 Train your eyes. Trust your strategy. Let price action lead the way.