The financial markets often reflect collective human behavior, and among the most telling of technical patterns is the Cup and Handle — a chart formation that elegantly encapsulates fear, hesitation, and eventual confidence in the market. Popularized by William O’Neil in his book How to Make Money in Stocks, the Cup and Handle is not just a pattern — it’s a story written in price.
🔍 What Is the Cup and Handle Pattern?
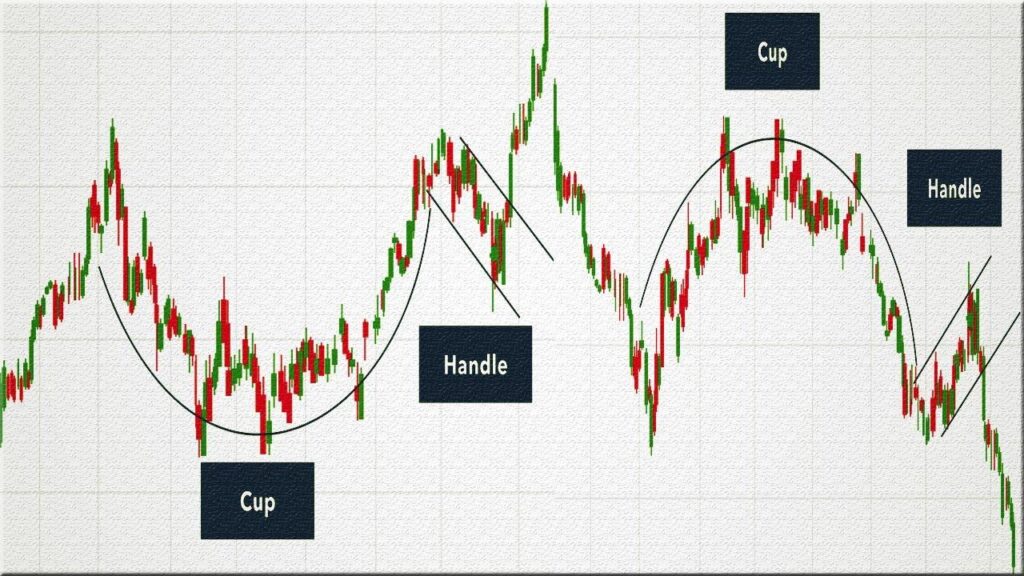
The Cup and Handle is a bullish continuation pattern that typically appears after an upward trend, pauses for consolidation, and then resumes upward momentum. It resembles a teacup, with a “U”-shaped cup followed by a slight downward or sideways handle, before a breakout to new highs.
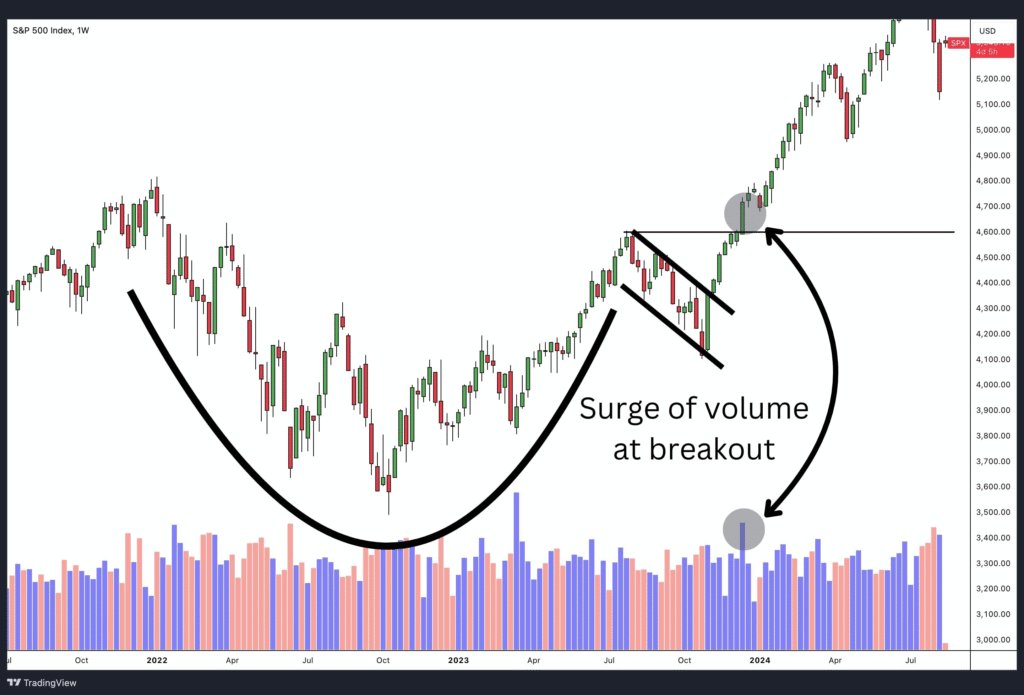
Breakout: Price moves above the resistance level formed at the rim of the cup, often triggering a sharp rally.
Cup: Represents a rounded bottom — a gradual decline followed by a gradual recovery.
Handle: A small pullback or consolidation near the resistance zone.
🧠 The Psychology Behind the Pattern Every technical pattern emerges from human psychology and the tug-of-war between buyers and sellers. The Cup and Handle is no different.
1. The Initial Rally and Peak (Left Rim of the Cup) The stock initially rallies to a peak, driven by optimism, strong earnings, or positive news. However, this surge often exhausts buyers, leading to a halt in upward movement. Early investors may book profits here, resulting in selling pressure.
2. The Decline (Cup Formation Begins) Selling pressure increases as profit-taking continues. Meanwhile, new investors hesitate to enter due to recent volatility. This creates a soft decline — not a crash, but a cautious downtrend. As the price drops, demand slowly dries up.
3. The Base of the Cup (Accumulation Phase) At the bottom of the cup, price stabilizes. This is where smart money (institutions and seasoned investors) often begins accumulating. Volume may be low, and the mood is indifferent or cautious. But under the surface, demand is quietly increasing.
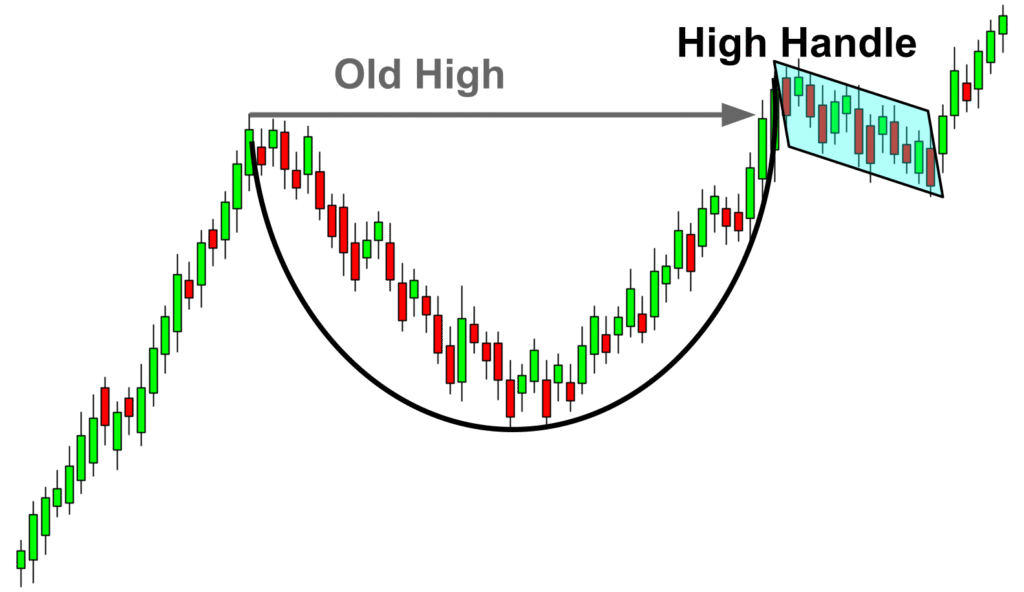
4. The Right Side of the Cup (Recovery) As the stock recovers, it begins to draw attention again. Investors who missed the first rally see an opportunity. Gradually, confidence rebuilds. Price approaches the previous high (resistance), where some sellers from the left side may still be waiting to exit. Volume begins to increase again.
5. The Handle (Shakeout and Retest) Just as price nears the breakout point, a minor pullback occurs — this is the handle. It’s a psychological test: traders become cautious, fearing a double top or a failed breakout. Some weak hands exit. But importantly, the pullback is shallow and controlled — suggesting that selling pressure is limited. Buyers are waiting for the right moment.
6. The Breakout (Resurgence of Demand) Once the handle ends, and price breaks above the resistance level (the “rim” of the cup), momentum buyers enter en masse. The previous hesitation gives way to strong demand, triggering a breakout. This marks the beginning of a new rally phase.
⚖️ Demand and Supply Dynamics 📉 During the Cup Formation: Supply > Demand: Sellers dominate as investors take profits. The gradual shape (versus a V-shape) suggests that selling is not panicked but systematic. Demand slowly builds near the base, indicating accumulation. 📈 During the Right Side Recovery: Demand ≈ Supply: Buyers and sellers are roughly balanced. As confidence builds, demand begins to outweigh supply, but resistance still holds. 📉 Handle Formation: A small group of traders exit early, causing a dip. However, supply is weak — indicating the market is preparing for a breakout. This controlled pullback often comes with declining volume, a sign of temporary consolidation rather than reversal. 🚀 Breakout: Demand > Supply: A surge in buying interest propels the price upward. Volume often spikes, confirming that institutional and retail traders are entering in force. Sellers from the earlier phase are now largely out of the way, clearing a path for momentum.
✅ Key Features of a Strong Cup and Handle Rounded Cup (not V-shaped): Indicates healthy accumulation. Handle Depth: Should be shallow (about 10–15% drop) and short (1–2 weeks in daily charts). Volume Behavior: Light during the cup. Lower during the handle. Spiking at breakout. Breakout Point: The high of the cup — also called the resistance level.
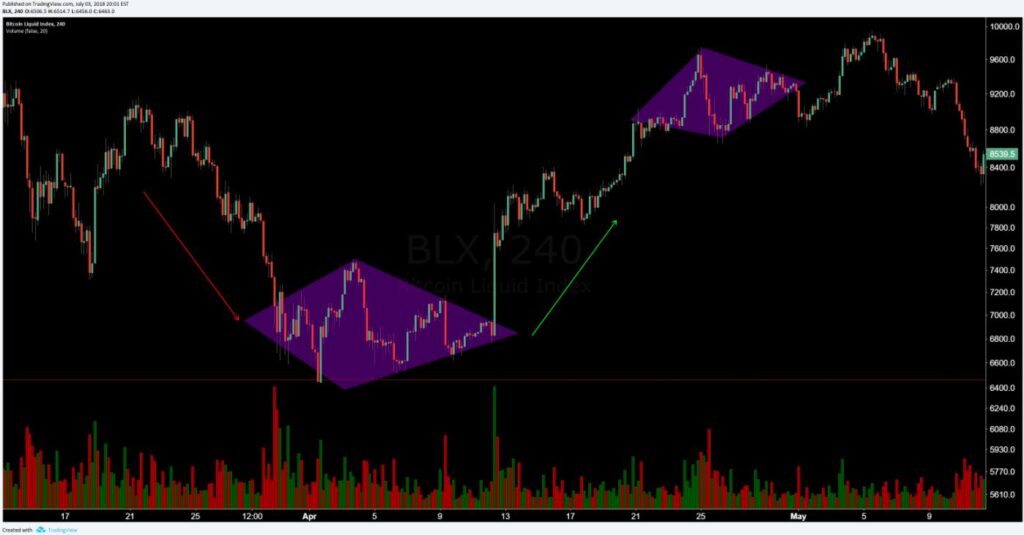
📈 Real-World Application The Cup and Handle is best used in: Daily and weekly charts (though it also appears intraday). Stocks, commodities, and even crypto. After uptrends, not downtrends — it’s a continuation pattern, not a reversal.
⚠️ Caution: Not Every Cup Is Golden Avoid cups that are too deep — they indicate excessive volatility. If the handle forms below the cup’s midpoint, it’s a weaker signal. Always confirm with volume and other indicators (RSI, MACD).
🧭 Final Thoughts The Cup and Handle is more than just a visual pattern — it’s a map of market sentiment, revealing how fear gives way to hope, hesitation to confidence. Behind every dip and rise in the pattern lies the collective psychology of buyers and sellers. Understanding the demand and supply dynamics beneath this structure allows a trader to anticipate breakouts more intelligently and avoid false signals. In a game where emotions often sabotage logic, the Cup and Handle stands as a reminder that patient, disciplined observation often wins. It’s not about catching every move. It’s about recognizing when the market is quietly getting ready to run.
📘 How to Trade the Cup and Handle Pattern Effectively
The Cup and Handle pattern offers a powerful visual cue for bullish breakouts. However, not every cup leads to a profitable rally. Smart traders confirm the pattern with candlestick signals, volume behavior, and technical indicators before placing trades. Here’s how to do it right.
🔑 Step-by-Step Strategy to Trade the Cup and Handle
🥇 Step 1: Identify a Valid Cup and Handle
Cup Shape: Look for a U-shaped base, not a sharp V. It should show a slow decline and recovery.
Handle: Should form near the top of the cup and slope slightly downward or sideways. Avoid deep handles (>15% drop).
Volume: Should decline during the cup and pick up during the right side and breakout.
🥈 Step 2: Wait for the Breakout Point
The buy point is the breakout above the cup’s rim (resistance).
This breakout should occur with increased volume.
A strong breakout candlestick (explained below) adds further confirmation.
🕯️ Candlestick Confirmation
Look for one of the following bullish candlestick patterns at the breakout point or near the end of the handle:
Look for a bullish MACD crossover during or just before breakout.
A rising MACD histogram also confirms momentum.
🥉 Step 4: Entry and Stop Loss Strategy
🎯 Entry:
Buy on the breakout candle close above the rim, ideally on high volume.
Conservative traders can wait for a pullback and retest of the breakout level (support turned resistance).
🛡️ Stop Loss:
Place a stop loss:
Below the handle low, or
4–5% below the breakout level, depending on the stock’s volatility.
📈 Step 5: Profit Targets and Exit Strategy
Measure the depth of the cup (from the top to the lowest point).
Project that same distance upward from the breakout point to get your initial profit target.
Example:
Cup top: $100
Cup low: $90 → Depth = $10
Breakout: $100
Target: $100 + $10 = $110
You can:
Take partial profits at the first target.
Use trailing stop-loss to ride the trend further.
🎓 Bonus Tips for Better Accuracy
Avoid trading weak or tilted patterns (e.g., cups with long, downward handles).
Prefer patterns on strong, trending stocks or growth sectors.
Combine with sector strength: if the whole sector is breaking out, pattern success rates increase.
Always confirm with multiple timeframes (e.g., handle on daily, cup on weekly).
📌 Summary Table
Element
Ideal Characteristics
Cup Shape
Rounded, U-shaped
Handle Slope
Slight downward/sideways, not deep
Volume
Low during cup, spikes on breakout
Breakout Candle
Bullish engulfing, Marubozu, or hammer
RSI
50–65 during handle; 65–75 on breakout
MACD
Bullish crossover before or during breakout
Entry Point
Breakout above cup’s rim, confirmed with volume
Stop Loss
Below handle low or 4–5% below breakout
Target Price
Cup depth projected upward from breakout
Sollicitudin bibendum nam turpis non cursus eget euismod egestas sem nunc amet, tellus at duis suspendisse commodo lectus accumsan id cursus facilisis nunc eget elementum non ut elementum et facilisi dui ac viverra sollicitudin lobortis luctus sociis sed massa accumsan amet sed massa lectus id dictum morbi ullamcorper.
Morbi ut viverra massa mattis vitae blandit ut integer non vestibulum eros, diam in in et hac mauris maecenas sed sapien fermentum et eu.