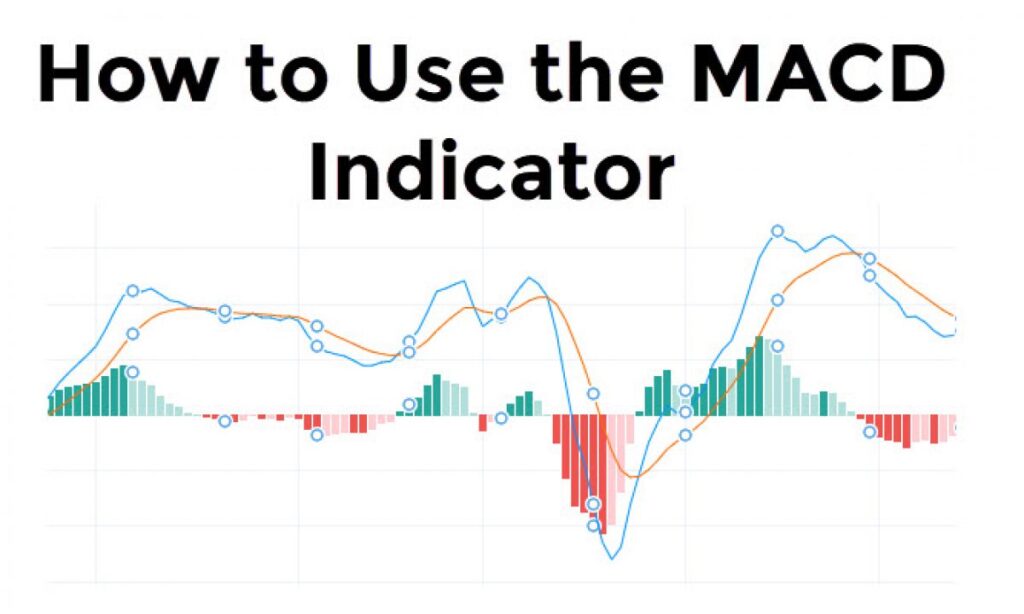
If the world of trading were a symphony, then the MACD would be its lead violin — versatile, expressive, and capable of playing both subtle and dramatic roles. Whether you’re a seasoned trader or just dipping your toes into the market waters, the Moving Average Convergence Divergence (MACD) is one indicator you cannot afford to ignore.
Let’s journey into the heart of this fascinating tool — exploring not only what it is and how it works, but why it works, how to tweak it across timeframes, and how to truly make it sing in your trading setup.
🎯 What Is MACD?
At its core, MACD is a momentum-following indicator. It helps traders spot changes in the strength, direction, momentum, and duration of a trend in a stock’s price.
But MACD isn’t just a single line. It’s a fusion of multiple moving averages, woven together into a visual that tells a story — if you know how to read it.
🔍 The Math Behind the Magic
Let’s demystify the formula — it’s actually quite elegant.
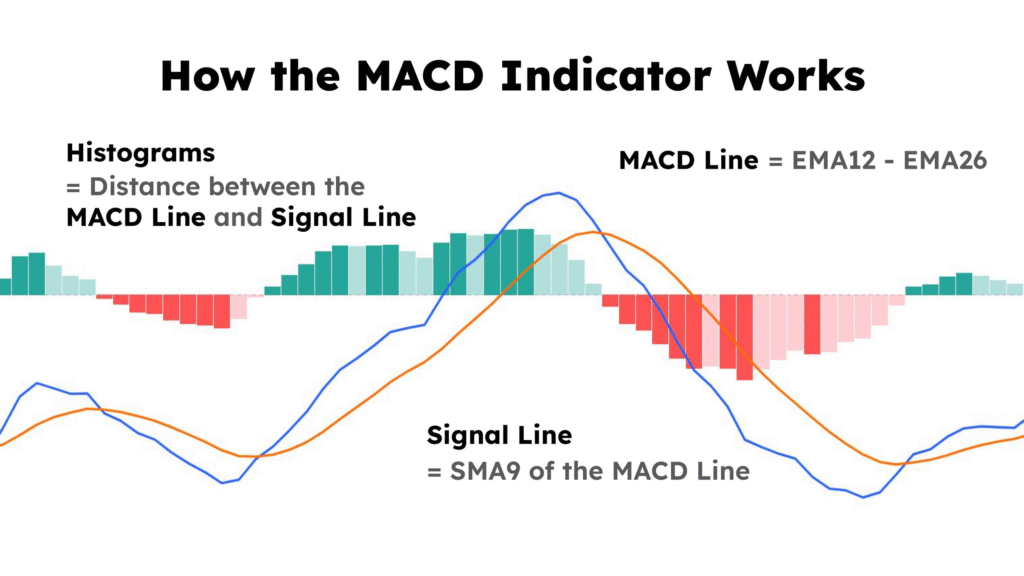
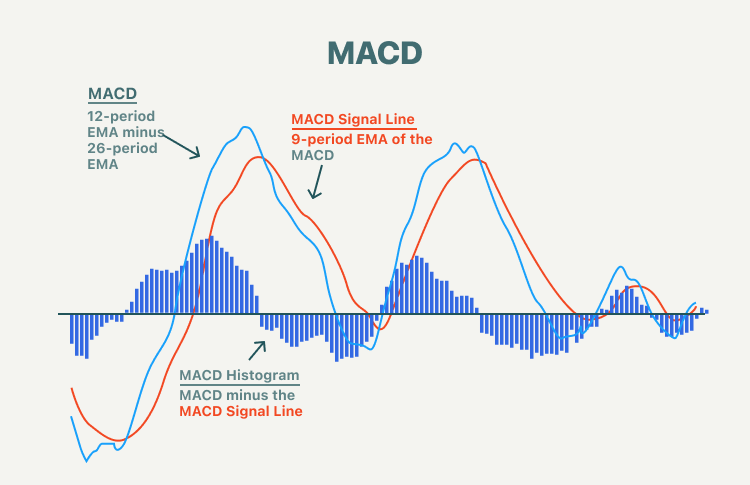
MACD Line = EMA(12) – EMA(26)
This line is the heart of the indicator. It subtracts the 26-period Exponential Moving Average (EMA) from the 12-period EMA. Why EMAs? Because they give more weight to recent data, making the indicator more responsive.
Signal Line = EMA(9) of the MACD Line
This is the MACD’s whisperer — a smoothed version that traders watch for crossovers.
Histogram = MACD Line – Signal Line
The histogram measures the distance between the MACD and the signal line — it’s a visual pulse of momentum shifts.
🧠 What Is It Really Showing?
The MACD is all about the dance of momentum:
- When the MACD line crosses above the signal line — that’s bullish. Traders call it a bullish crossover.
- When it crosses below — bearish crossover.
- When the histogram grows — increasing momentum.
- When it shrinks — momentum is fading.
But here’s the nuance: MACD is a lagging indicator, meaning it’s based on past prices. Yet when read contextually, it provides clues about what’s brewing beneath the surface of price action.
🧭 Using MACD Across Timeframes
This is where things get really interesting — and where most traders either flourish or flounder.
🕐 Short Timeframes (1-min, 5-min, 15-min)
- Use Case: Scalping or day trading
- Behavior: MACD reacts very quickly, but is also more prone to false signals due to market noise.
- Tweaks: Try tighter settings like EMA(6), EMA(13), Signal(5) to speed it up.
- Tip: Pair with strong price action or volume confirmation to avoid being whipsawed.
🕓 Medium Timeframes (1-hour, 4-hour)
- Use Case: Swing trades, intraday holds
- Behavior: More stable, offers cleaner signals with manageable risk.
- Tweaks: Standard settings often work well (12, 26, 9), but some traders opt for (10, 20, 6) for faster reaction.
- Tip: Use with RSI or trendlines to filter high-quality signals.
📅 Long Timeframes (Daily, Weekly)
- Use Case: Position trading, investing
- Behavior: Less noise, stronger signals. A bullish crossover on the weekly MACD can precede major moves.
- Tweaks: Consider EMA(19), EMA(39), Signal(9) for smoother long-term tracking.
- Tip: Combine with fundamental analysis — MACD on long timeframes reflects big investor behavior.
🌌 Multi-Timeframe Mastery: Reading the MACD Like a Pro
Want to elevate your trading? Think in layers. Here’s how:
- Top-Down Analysis:
Start with a higher timeframe (Daily or Weekly) MACD to understand the primary trend. - Drill Down:
Move to mid timeframes (4H or 1H) to catch intermediate momentum shifts. - Fine-Tune Entries:
Use lower timeframes (15min or 5min) to find optimal entries when the higher timeframes align.
🧠 Golden Insight:
When MACD is aligned across multiple timeframes, it acts like a green light for trend continuation. If they conflict, expect volatility or sideways movement.
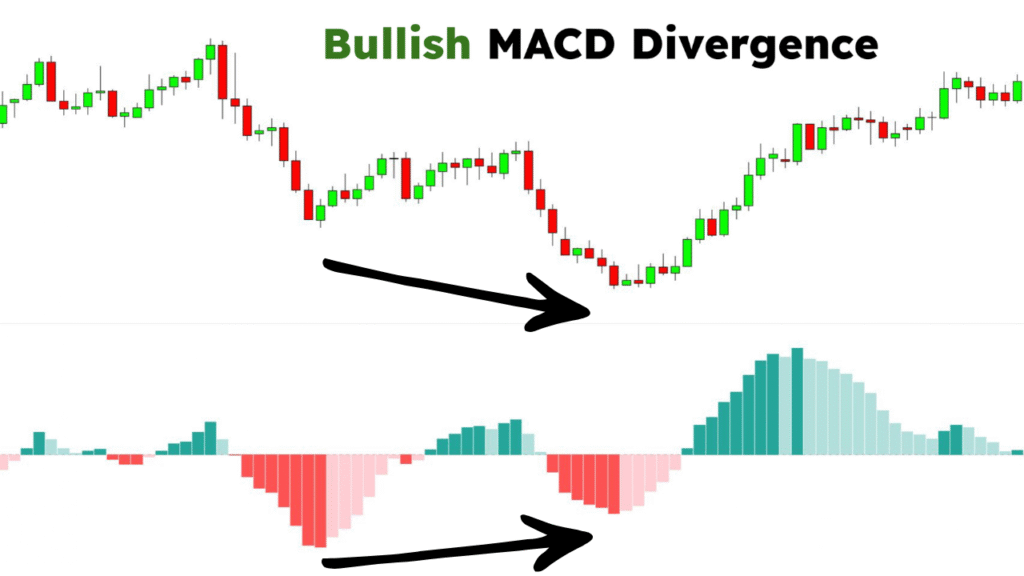
🌀 Divergences: The MACD’s Hidden Superpower
This is where MACD starts whispering secrets.
- Bullish Divergence: Price makes lower lows, MACD makes higher lows → momentum is building under the surface.
- Bearish Divergence: Price makes higher highs, MACD makes lower highs → trend is weakening.
These signals often appear before big reversals and are incredibly powerful when used with support/resistance zones.
🛠️ Customizing the MACD — Is It Allowed?
Yes! While the default 12-26-9 configuration works well for many, remember: the market is not one-size-fits-all. Experiment with settings to suit your asset and timeframe.
Here are some experimental setups:
| MACD Settings | Use Case |
|---|---|
| 5, 13, 8 | Quick scalping in volatile markets |
| 8, 17, 9 | Intraday swing trading |
| 19, 39, 9 | Long-term investment signals |
| 3, 10, 16 | Smoothed MACD for trend-following |
Pro Tip: Always backtest custom settings before live trading.
🧩 Final Thoughts: MACD Is More Than a Line
The MACD isn’t just an indicator — it’s a storyteller. It narrates the ebb and flow of market momentum. But like any tool, it’s only as powerful as the context you apply it in.
Pair MACD with your favorite patterns, support/resistance zones, Fibonacci levels, or price action. Use it across timeframes. Respect divergences. And most importantly, never use it in isolation — because the market is a symphony, not a solo act.
✨ TL;DR
- MACD = EMA(12) – EMA(26); Signal = EMA(9) of MACD
- Shows momentum shifts, trends, and potential reversals.
- Works differently across timeframes — adjust settings accordingly.
- Multi-timeframe MACD analysis increases your edge.
- Divergences reveal hidden market intentions.
- Customize, test, and combine with other tools.
Trading with MACD revolves around spotting momentum shifts and trend reversals using crossovers, divergences, and histogram analysis. Here’s a breakdown of when to buy and sell based on MACD signals:
✅ BUY Signal (Go Long)
- MACD Line Crosses Above Signal Line
- Indicates bullish momentum.
- Confirm with price breaking resistance or increasing volume.
- MACD Line Crosses Above Zero Line
- Suggests trend is turning positive.
- Ideal for trend-following entries.
- Bullish Divergence
- Price forms lower lows, but MACD forms higher lows.
- Sign of hidden strength and likely reversal.
- Rising Histogram (after crossover)
- Shows increasing momentum — signal is gaining strength.
Entry Tip:
Buy after a bullish crossover with MACD rising and price breaking out of a consolidation or resistance zone.
❌ SELL Signal (Go Short / Exit Long)
- MACD Line Crosses Below Signal Line
- Indicates bearish momentum.
- Exit or short if confirmed by falling price.
- MACD Line Crosses Below Zero Line
- Confirms trend has turned bearish.
- Bearish Divergence
- Price forms higher highs, but MACD forms lower highs.
- Suggests weakening momentum and possible drop.
- Falling Histogram
- Signals momentum fading even if price is still rising.
Exit Tip:
Sell or short after a bearish crossover with price failing to break recent highs and MACD trending down.
⚠️ Pro Tips
- Use higher timeframes to confirm the trend before entering on a lower one.
- Avoid signals in flat or choppy markets — MACD works best in trending environments.
- Combine with volume, support/resistance, or RSI for higher accuracy.
- Wait for confirmation candles (e.g., bullish engulfing or breakout) after a crossover.
🧠 1-Hour MACD Trading Strategy
⚙️ MACD Settings (Recommended for 1H)
- MACD Line: EMA(12) – EMA(26)
- Signal Line: EMA(9) of MACD
👉 (You can optionally try 10-20-6 for a slightly faster signal)
🛒 When to BUY (Long Entry)
- ✅ Bullish MACD Crossover
- MACD line crosses above the signal line.
- Happens below the zero line = early reversal signal.
- Happens above the zero line = trend continuation.
- ✅ MACD Histogram Turns Positive
- Indicates growing momentum.
- Ideally, this follows a price breakout or strong bullish candle.
- ✅ Price Action Confirms
- Price breaks above recent resistance or forms a bullish pattern (e.g. flag breakout, higher low).
🔔 Entry Signal Example:
MACD crosses up, histogram starts growing, and a bullish engulfing candle breaks above a key resistance zone.
🛑 Stop Loss: Below recent swing low
🎯 Take Profit: 1.5x or 2x stop distance, or near next resistance
💰 When to SELL (Short Entry or Exit Long)
- ❌ Bearish MACD Crossover
- MACD line crosses below the signal line.
- More powerful if near or above zero line (suggests a weakening uptrend).
- ❌ MACD Histogram Turns Negative
- Signals loss of bullish momentum.
- ❌ Price Action Confirms
- Price breaks support or forms a bearish pattern (e.g., double top, lower high).
🔔 Exit Long / Go Short Example:
After a failed breakout, MACD crosses down and the histogram dips negative, confirmed by a bearish candle.
🛑 Stop Loss: Above recent swing high
🎯 Take Profit: Next support level or risk-reward based target
🔁 Bonus: Multi-Timeframe Edge
- 4H chart: Use to confirm direction. If MACD is bullish on 4H, prefer long trades on 1H.
- 15min chart: Use to refine entries after 1H setup is confirmed.
📊 Quick Recap: 1H MACD Trade Checklist
| Criteria | Long (Buy) | Short (Sell) |
|---|---|---|
| MACD crossover | Above signal | Below signal |
| MACD line vs. zero | Approaching/up | Approaching/down |
| Histogram | Turning positive | Turning negative |
| Price action | Bullish breakout | Bearish breakdown |
| Volume (optional) | Expanding | Expanding |
While the MACD is powerful on its own, it becomes much more accurate when combined with other technical tools. Think of MACD as a “momentum compass” — it points you in the right direction, but to avoid false signals, it’s best to pair it with other indicators and analysis techniques.
Here are some top supporting tools for MACD:
🔧 1. RSI (Relative Strength Index)
- What it does: Measures overbought and oversold conditions.
- Why it helps: Confirms whether momentum signals from MACD are backed by strength or weakness.
✅ Best Use:
- If MACD gives a bullish crossover, and RSI is rising from below 30 → strong buy signal.
- If MACD shows bearish divergence, and RSI is above 70 → strong sell signal.
📉 Support and Resistance Levels
- What it does: Identifies key price zones where reversals or breakouts happen.
- Why it helps: MACD signals are more reliable near these levels.
✅ Best Use:
- Buy when MACD turns bullish near support.
- Sell when MACD turns bearish near resistance.
📏 Trendlines & Channels
- What it does: Shows the direction and structure of price movement.
- Why it helps: MACD works best in trending markets.
✅ Best Use:
- Trade MACD crossovers when they happen in the direction of the overall trend (confirmed by trendlines).
- Use MACD divergence to spot early trend reversals at the end of a channel.
🔲 Price Action & Candlestick Patterns
- What it does: Gives context to MACD signals.
- Why it helps: Candles reveal how traders are behaving around key MACD events.
✅ Best Use:
- Confirm MACD crossovers with strong patterns like engulfing candles, pin bars, or inside bars.
🔊 Volume (or OBV – On Balance Volume)
- What it does: Shows the strength behind price moves.
- Why it helps: Volume rising with MACD momentum confirms the move is supported by buyers/sellers.
✅ Best Use:
- Bullish MACD with rising volume = high-quality long entry.
- Bearish MACD with falling volume = strong short entry.
⏱️ Multi-Timeframe Analysis
- What it does: Confirms trend alignment across timeframes.
- Why it helps: MACD signals are more effective when supported by higher timeframes.
✅ Best Use:
- If MACD is bullish on the 4H, prefer buy entries on 1H when it turns up.
🔍 Summary: Top MACD Supporting Tools
| Tool | Role | Why It Works with MACD |
|---|---|---|
| RSI | Confirms momentum strength | Filters false MACD signals |
| Support/Resistance | Context for entries/exits | MACD near key zones = higher success |
| Trendlines | Defines trend direction | MACD works best in trend |
| Candlesticks | Validates signals visually | Adds precision and timing |
| Volume/OBV | Measures strength of moves | Confirms real buying/selling |
| Multi-Timeframe | Adds alignment | Boosts probability of success |
📊 Riding the Pulse of the Market: How to Trade Using the MACD Histogram
If the MACD line and signal line are the “brain” of the MACD indicator, then the MACD histogram is its heartbeat — a real-time pulse of momentum that can tell you exactly when the market is picking up speed or running out of steam.
In this guide, you’ll learn how to trade purely based on the MACD histogram, using it to enter earlier, exit smarter, and catch momentum shifts like a seasoned pro.
🧠 What Is the MACD Histogram?
The MACD histogram simply shows the difference between the MACD line and the signal line.
📐 Formula:
Histogram = MACD Line – Signal Line
This difference is plotted as bars above or below a zero line:
- Above zero = MACD is above the signal line → bullish momentum.
- Below zero = MACD is below the signal line → bearish momentum.
But the real power lies in how these bars grow and shrink.
🔍 How to Read It Like a Pro
📈 Growing Histogram Bars
- Means the distance between MACD and Signal is increasing.
- Momentum is accelerating in the current direction.
👉 If bars grow above zero → bullish acceleration
👉 If bars grow below zero → bearish acceleration
📉 Shrinking Histogram Bars
- Indicates momentum is fading, even if price is still moving.
- This is a warning: trend may reverse or consolidate soon.
👉 If bars shrink above zero → bullish momentum is slowing
👉 If bars shrink below zero → bearish momentum is weakening
🎯 Histogram-Based Trade Signals
✅ 1. Early Entry on Momentum Surge
- Enter a trade when the histogram changes direction (starts growing after shrinking).
- This often gives an earlier entry than waiting for the MACD line crossover.
🟢 Buy Signal:
- Histogram flips from negative to growing toward zero.
- Indicates bullish momentum is returning.
🔴 Sell Signal:
- Histogram flips from positive to shrinking toward zero.
- Indicates bearish momentum is building.
🌀 2. Trade the Momentum Waves
Use the histogram like a wave monitor:
- Buy when histogram dips and starts rising again (even if still below zero).
- Sell when histogram peaks and starts falling (even if still above zero).
This helps you:
- Ride momentum waves within a trend.
- Get in early on the next leg of a move.
✅ Ideal for scalping and swing trading.
🧨 3. Spot Hidden Divergences
MACD histogram can reveal divergence even better than the lines:
🔍 Bullish Divergence:
- Price makes lower lows
- Histogram makes higher lows
🔍 Bearish Divergence:
- Price makes higher highs
- Histogram makes lower highs
These divergences often precede strong reversals — especially when confirmed by candlestick patterns or support/resistance levels.
⏱️ 4. Time Exits with Shrinking Histogram
Let the histogram guide your exit by showing when momentum weakens.
- In a long trade, exit when the histogram starts shrinking after a strong bullish phase.
- In a short trade, exit when bearish histogram peaks and starts to shrink.
This keeps you in the trend during strength and gets you out before reversals.
🔧 Strategy Example: Histogram-Only Entry (1H Chart)
- Wait for histogram to flip from negative to positive and start growing.
- Enter long trade on the next candle close.
- Stop-loss: below recent swing low.
- Take profit: 1.5–2x stop, or when histogram starts to shrink.
🔁 You can reverse this for a short trade.
🛠️ Combine With Other Tools for Maximum Power
While you can trade with histogram alone, your win rate increases by adding:
- RSI: Confirms strength of reversal.
- Trendlines: Align entries with the broader trend.
- Volume: Strong moves should have rising volume.
- Candlestick patterns: e.g., engulfing, pin bars, doji near histogram flips.
✅ Recap: MACD Histogram Trading at a Glance
| Signal Type | What to Look For | Action |
|---|---|---|
| Momentum Surge | Histogram flips and grows | Enter in direction |
| Weakening Trend | Histogram shrinks | Prepare to exit |
| Divergence | Histogram disagrees with price movement | Watch for reversal |
| Confirmation Tool | Pair with RSI, price action, volume | Higher accuracy |