The Market’s Warning Bell
In the exciting and often unpredictable world of trading, certain chart patterns act like whispers from the market, telling those who can listen exactly what’s about to unfold. One of the most powerful of these signals is the Bearish Head and Shoulders pattern — a classic formation that has helped smart traders predict tops and ride reversals for decades.
But here’s the twist: most traders miss its real power, or worse, they jump in too early. This blog post will not only explain the formation of this majestic pattern, but also help you decode the psychology of supply and demand, and give you practical techniques to trade it like a seasoned pro.
📉 What is the Bearish Head and Shoulders Pattern?
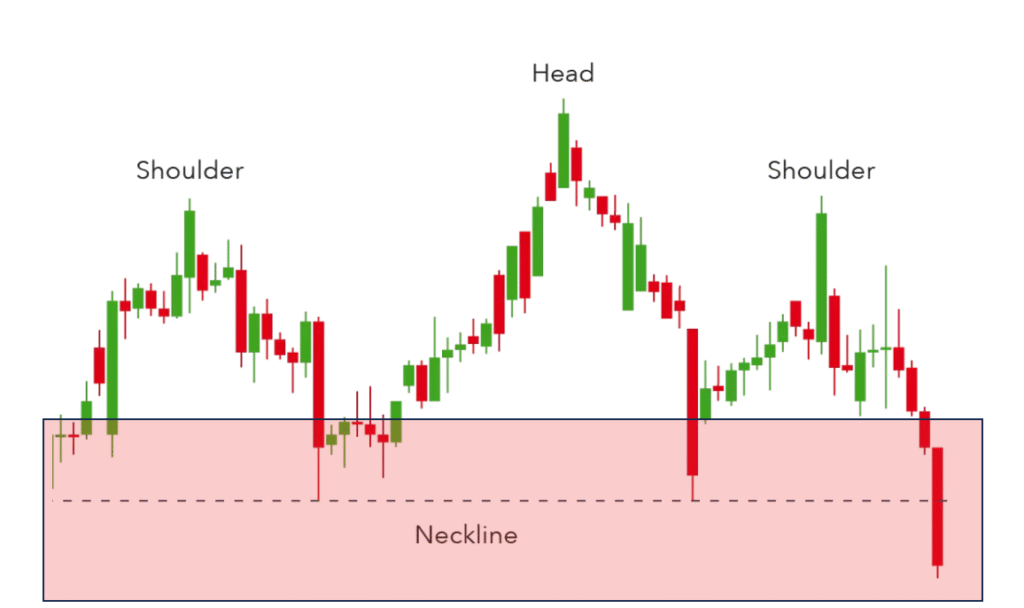
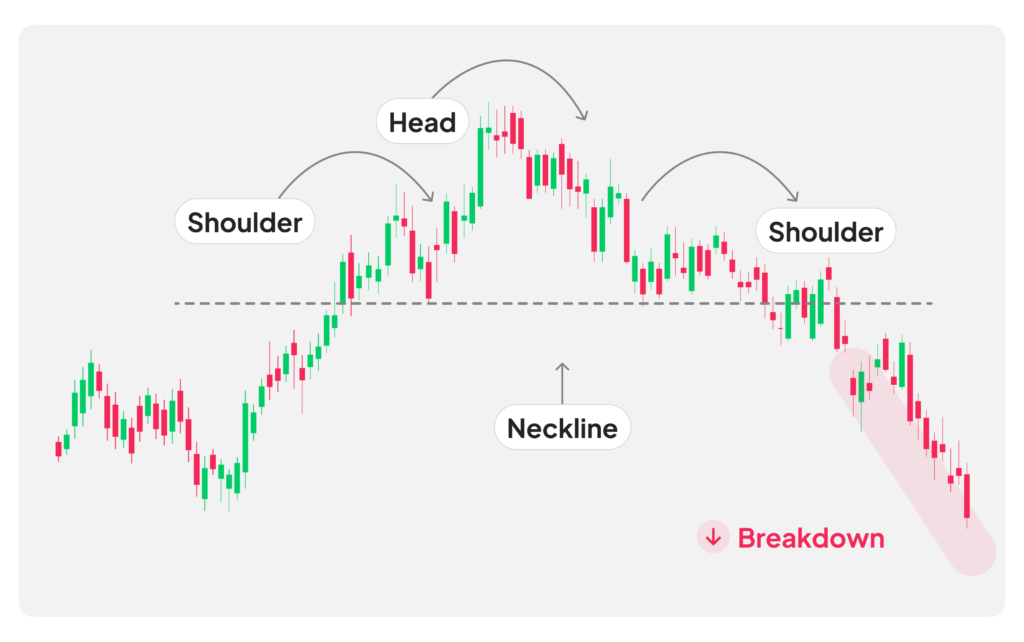
The Bearish Head and Shoulders is a trend reversal pattern that signals the end of an uptrend and the start of a potential downtrend. It is shaped like a shoulder–head–shoulder formation, with a rising neckline that, once broken, confirms bearish sentiment.
📌 Key Features:
- Left Shoulder: A peak followed by a retracement.
- Head: A higher peak followed by another retracement.
- Right Shoulder: A lower peak, failing to make a new high.
- Neckline: The line connecting the two retracements (support level). The pattern is confirmed when this line is broken downward.
🧠 Why Does This Pattern Form? — The Psychology
Every price chart tells a story of supply and demand — and this pattern is the traders’ tale of exhausted optimism:
🟢 Left Shoulder:
- Bulls are in control, pushing prices higher.
- Sellers enter and cause a minor pullback (healthy in any uptrend).
🔵 Head:
- Bulls fight harder, setting a new high — the peak of optimism.
- But… the pullback here is deeper and sharper. Cracks begin to show.
🟠 Right Shoulder:
- Bulls attempt to rally again, but this time they fail to beat the previous high.
- Momentum fades. Sellers smell weakness.
- Smart money exits; bears prepare to strike.
🔻 Neckline Break:
- Once the neckline is broken, it’s game over for the bulls.
- Supply overwhelms demand, confirming the trend reversal.
🔍 Hidden Insight Most Traders Miss
Most traders simply draw the pattern and enter blindly — but here’s what they often fail to notice:
🔥 The volume tends to decrease as the head forms and increases on the right shoulder’s failure. When the neckline breaks with a volume spike, it’s the market screaming reversal — not whispering it.
Also, bear traps (fake breakouts) are common. The smart trader waits for a clean close below the neckline with volume confirmation, or even a retest of the neckline after the break.
📈 The Perfect Setup – How to Use it Most Effectively
✅ Step-by-Step Trading Strategy:
- Identify the Structure:
- Look for a visible left shoulder, head, and right shoulder in an uptrend.
- Ensure symmetry (shoulders at similar levels).
- Use a clean, high timeframe (1H, 4H, or Daily).
- Draw the Neckline:
- Connect the two swing lows under the left and right shoulders.
- Flat or slightly upward is ideal.
- Wait for the Breakout:
- Enter after the price closes below the neckline.
- Confirm with volume increase or RSI/MACD divergence.
- Set Entry and Stop-Loss:
- Entry: On the break or retest of the neckline.
- Stop-loss: Just above the right shoulder.
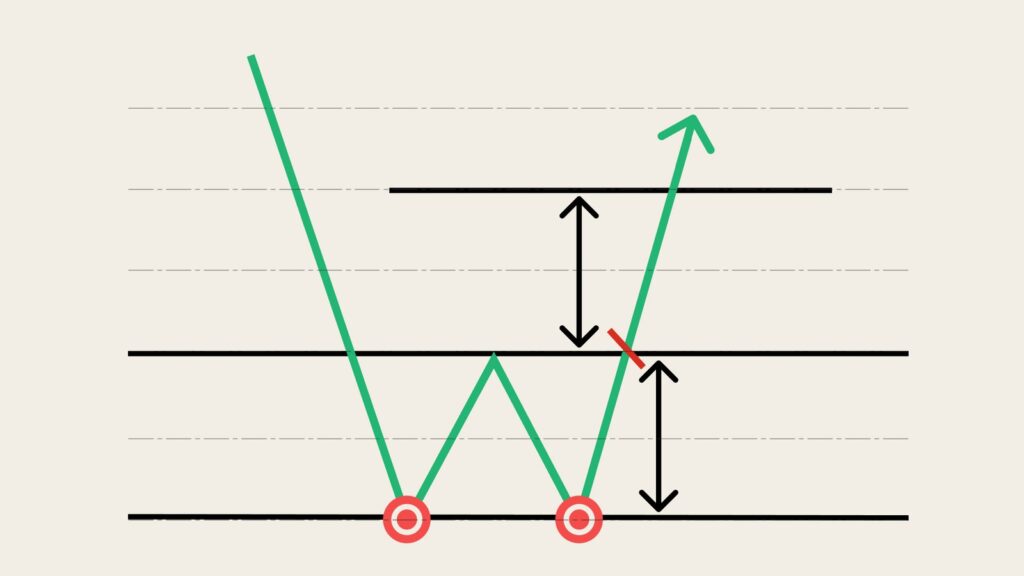
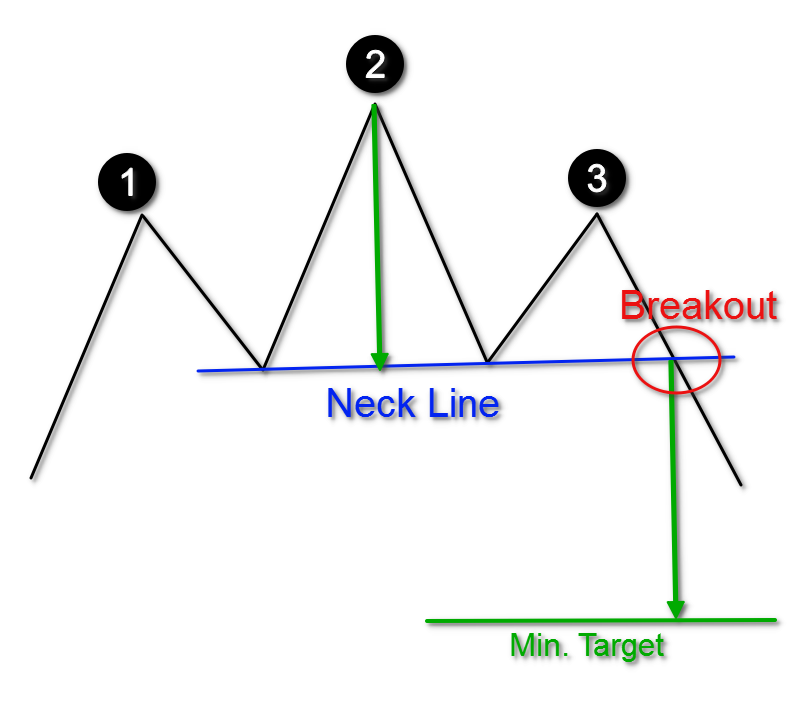
- Target Price:
- Measure the distance from the head to the neckline.
- Project that downward from the breakout point.
🎯 For example:
Head at ₹150, Neckline at ₹130 → Target = ₹110
📆 Best Timeframes to Trade
| Timeframe | Use Case |
|---|---|
| 1H – 4H | Ideal for swing trades and short-term setups |
| Daily | Best for long-term position trades |
| 15m – 30m | Riskier, often noisy (use with caution) |
📊 Tools to Combine With It
| Tool | Why Use It |
|---|---|
| Volume Profile | Confirm heavy supply at neckline |
| RSI | Look for bearish divergence at the head |
| MACD | Look for crossover and momentum shift |
| Trendlines | Confirm the overall reversal context |
⚠️ Mistakes to Avoid
- Entering too early (before confirmation)
- Ignoring volume signals
- Overtrading small timeframes
- Not considering market sentiment or news catalysts
🔮 Real-Life Example
In early 2020, many stocks and indices formed clean Head and Shoulders patterns before the COVID crash. Traders who recognized the pattern, waited for neckline breaks, and rode the wave down — made solid returns.
💬 Final Thoughts
The Bearish Head and Shoulders is not just a shape — it’s a warning bell from the market. When interpreted properly, it gives you a strategic advantage, offering high-probability shorting opportunities.
Remember, this pattern rewards discipline, patience, and confirmation-based entries. Combine it with smart volume analysis and indicators, and it becomes a powerful weapon in your trading toolkit.
So next time you spot that telltale “shoulder-head-shoulder” formation, don’t just trace it — listen to what the market is whispering… or shouting.