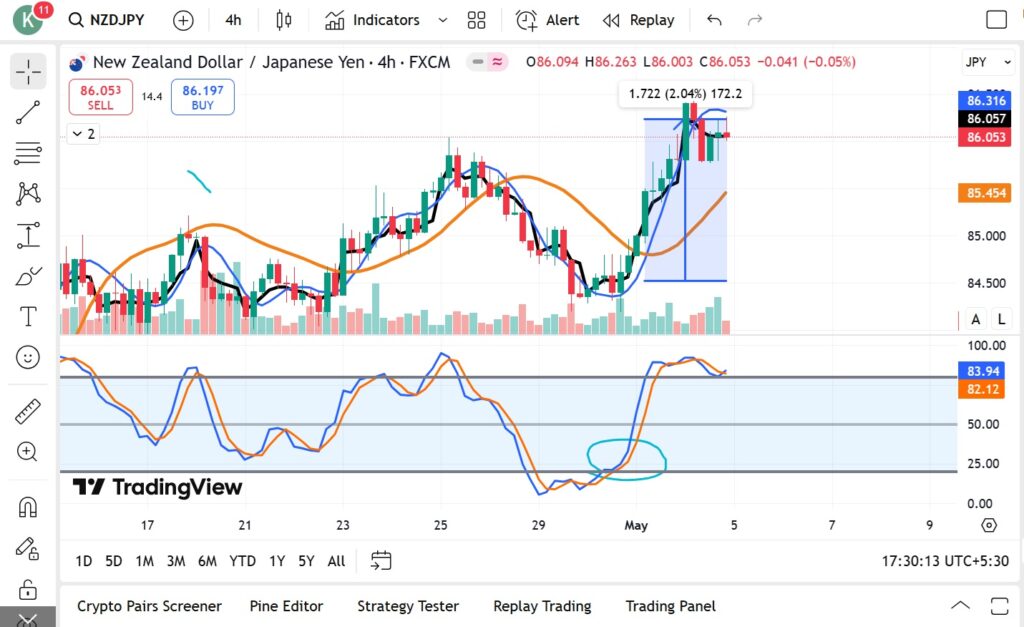
Whispers of the Curve: Decoding the Market’s Hidden Rhythm with Stochastic
The Secret Language of Stochastic In the chaotic dance of the market, every candlestick is a footprint. But beneath this chaos lies a current—an invisible wave. The stochastic oscillator is the compass that reveals whether the market is tired or thirsty for more. This isn’t about overbought or oversold.This is about energy. Watch closely: A […]
Whispers of the Curve: Decoding the Market’s Hidden Rhythm with Stochastic Read More »
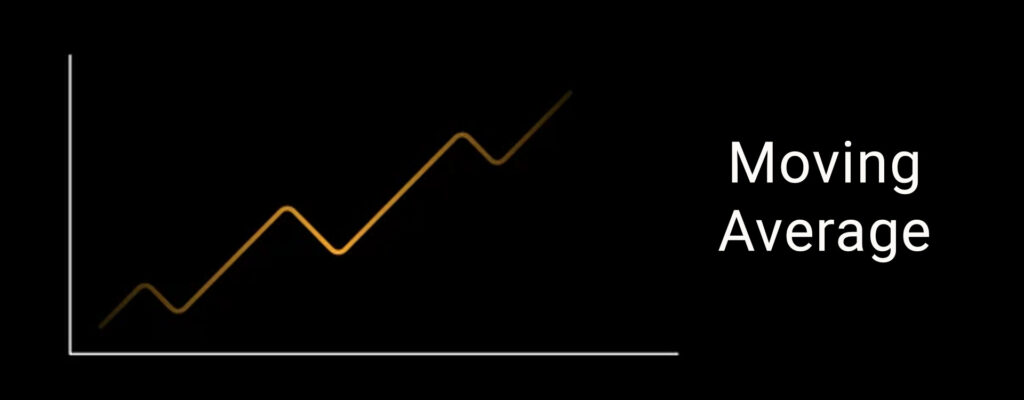
 The Moving Average Masterpiece: Riding the Market’s Most Legendary Wave

 What is
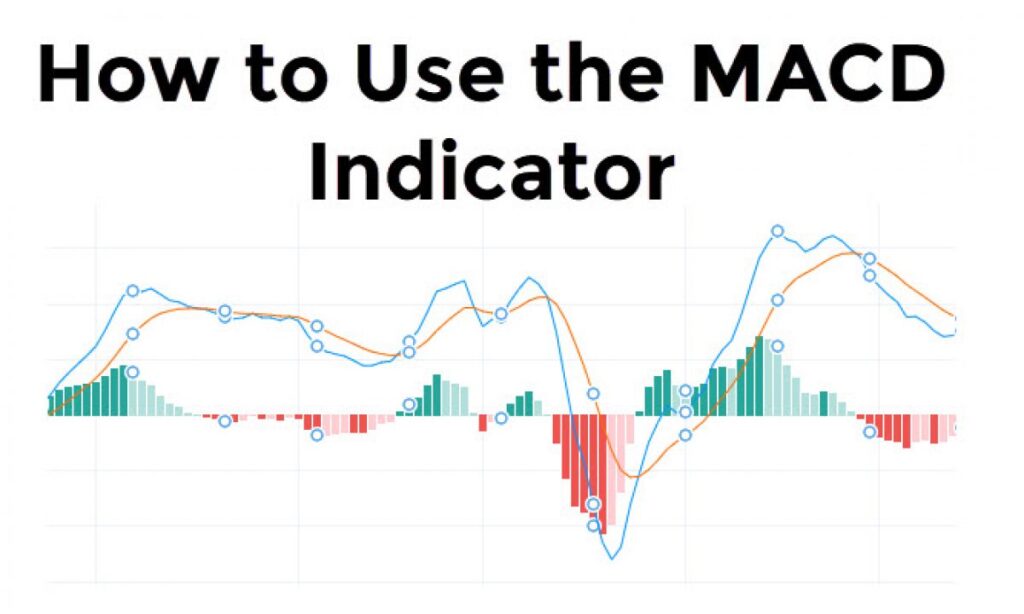

 Keltner Channel: The Hidden Gem of Trend and Volatility Trading