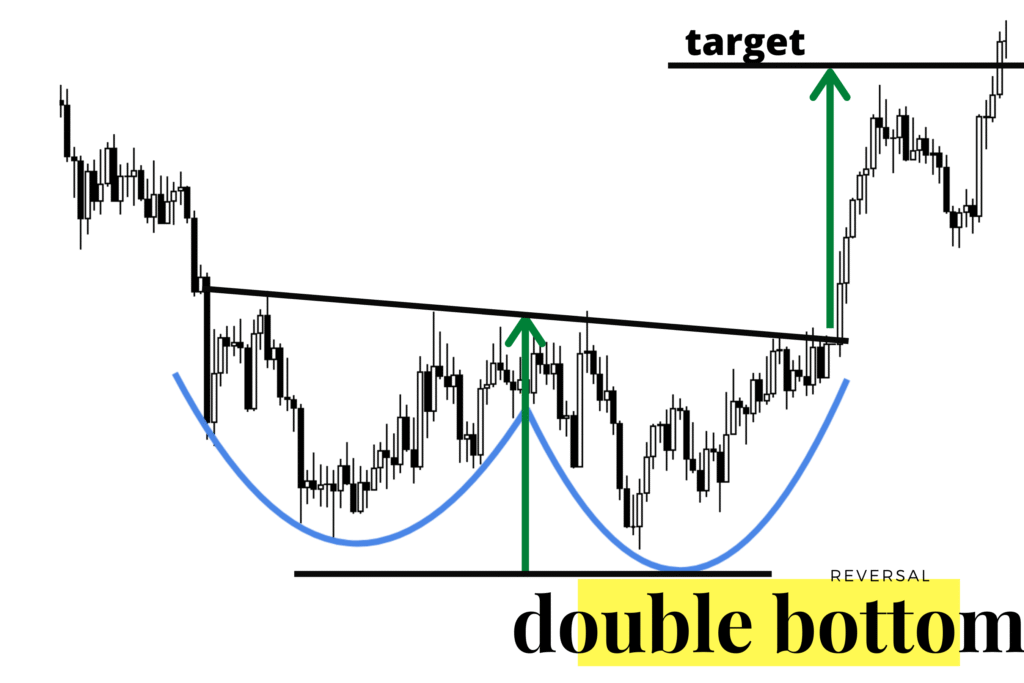
In the dynamic world of technical analysis, few patterns are as powerful and reliable as the Double Bottom. Often signaling a trend reversal from bearish to bullish, this pattern helps traders pinpoint entry zones with relatively low risk and high potential.
Whether you’re a beginner or an experienced trader, understanding the structure, psychology, and optimal usage of the Double Bottom can significantly improve your trading decisions.
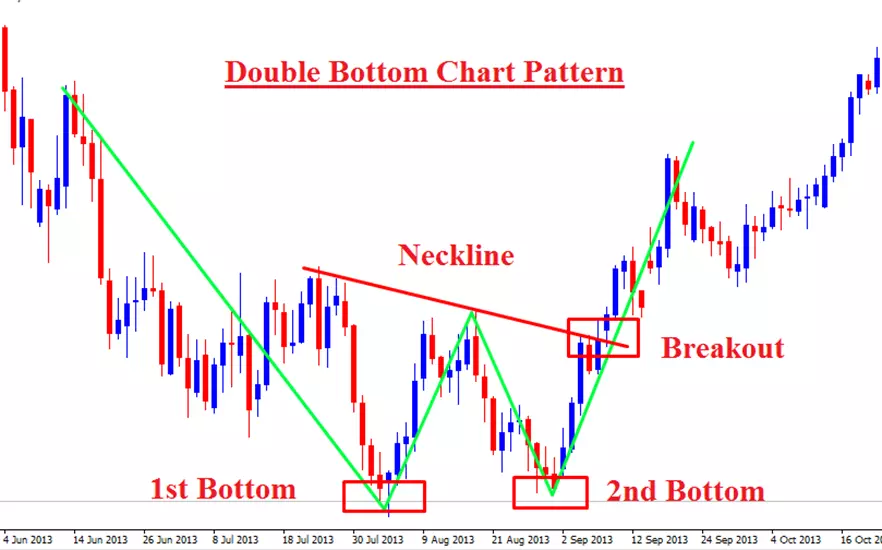
🔍 What is a Double Bottom Pattern?
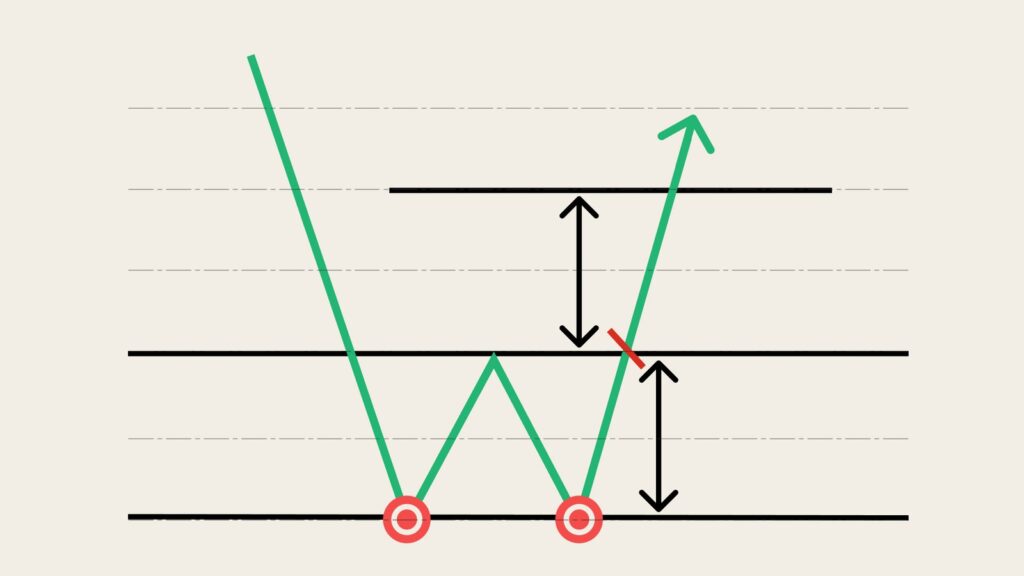
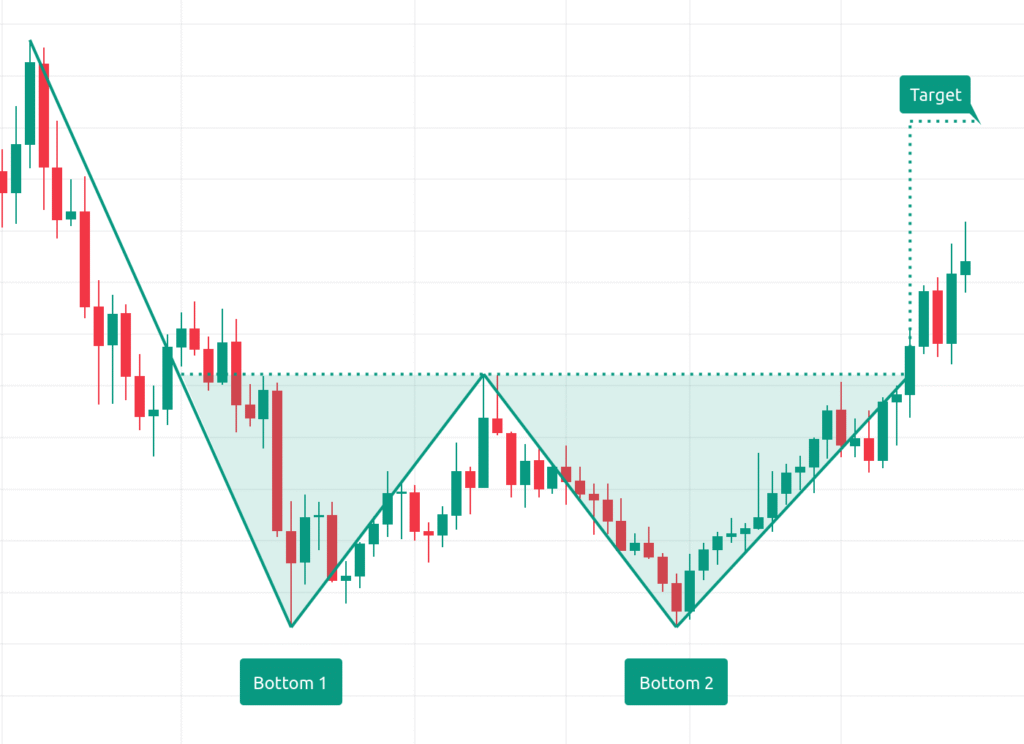
The Double Bottom is a bullish reversal chart pattern that resembles the letter “W”. It forms after a sustained downtrend and suggests that the selling pressure is weakening — setting the stage for a potential upward move.
✅ Key Features:
- Two distinct lows roughly at the same price level.
- A peak or neckline between the two lows.
- A breakout above the neckline confirms the pattern.
🧠 The Psychology Behind the Double Bottom
Understanding demand and supply dynamics is crucial in interpreting any pattern. Here’s what’s happening inside the market:
🟢 First Bottom:
- Sellers are in control, continuing the downtrend.
- Price hits a new low but buying interest begins to emerge.
- A bounce occurs due to oversold conditions or support.
🟠 Neckline Formation:
- Price rises as sellers take profits and buyers enter cautiously.
- The upward move faces resistance (neckline).
- If bullish strength is insufficient, the price drops again.
🔵 Second Bottom:
- Price tests the previous low again.
- Sellers try to break it, but fail due to stronger demand.
- Buyers step in again — now with more confidence.
🚀 Breakout:
- The price breaks the neckline.
- This breakout signals a shift from supply dominance to demand dominance.
- A bullish trend reversal begins.
🕒 Best Timeframes to Trade the Double Bottom
| Timeframe | Use Case |
|---|---|
| 15m – 1H | Intraday or scalping trades. Confirm with volume. |
| 4H – Daily | Best for swing trading. More reliable and less noise. |
| Weekly | Strong long-term trend reversals. Best for position trading or investing. |
📌 Note: The higher the timeframe, the stronger and more reliable the pattern.
📈 How to Trade the Double Bottom Pattern
✅ Step-by-Step Strategy:
- Identify the Pattern
- Look for a clear “W” shape after a downtrend.
- Both bottoms should be similar in price (within 2–5% range).
- Draw the Neckline
- Connect the high between the two bottoms.
- Wait for Confirmation
- Do not enter early — wait for a breakout above the neckline with good volume.
- Enter the Trade
- Buy on the breakout or after a retest of the neckline.
- Set Stop-Loss
- Below the second bottom or just under the neckline if retest fails.
- Target Price
- Measure the distance between the neckline and the bottom.
- Project that same distance upward from the neckline (target = neckline + height).
🧮 Example:
- Bottom: ₹100
- Neckline: ₹120
- Breakout: above ₹120
- Target: ₹140
- Stop-loss: ₹95–100
📊 Using Indicators for Confirmation
While the Double Bottom is powerful on its own, combining it with indicators improves your accuracy:
| Indicator | Role |
|---|---|
| Volume | Look for higher volume on the breakout. |
| RSI | Should show bullish divergence or cross above 50. |
| MACD | Confirm MACD crossover after second bottom. |
| Moving Averages | 50 MA or 200 MA crossovers support trend reversal confirmation. |
⚠️ Common Mistakes to Avoid
- Entering Before Breakout: Always wait for neckline break.
- Misidentifying Ranges: Double bottoms must be after a downtrend.
- Ignoring Volume: Weak volume = possible false breakout.
- Forcing the Pattern: Not every “W” is a real double bottom.
📚 Summary Table
| Element | What to Look For |
|---|---|
| Trend | Downtrend before pattern |
| Shape | W-shaped, equal lows |
| Neckline | Resistance between bottoms |
| Breakout | Candle closes above neckline |
| Confirmation | Volume, RSI, MACD |
| Timeframes | 1H – Daily (ideal) |
🧠 Understanding Demand and Supply Psychology Behind the Double Bottom
The Double Bottom pattern is more than a “W” on the chart — it’s a real-time conversation between buyers and sellers, revealing the silent battle of demand versus supply. When the price hits the first bottom, supply is still dominant, dragging the market downward. But as price begins to recover, it hints that demand is quietly stepping in, absorbing the sell orders. This mini rally toward the neckline is not yet a reversal, but a warning sign that bears are losing grip. When the second bottom forms near the same level, something interesting happens: supply tries again, but fails to create a new low. The market finds support at the same price, confirming that buyers are becoming more aggressive. The final act — the breakout above the neckline — signals that demand has overpowered supply, flipping control and setting the stage for a bullish trend. It’s this shift in pressure, visible through price structure, that makes the Double Bottom such a powerful roadmap of changing market sentiment.
💬 Final Thoughts
The Double Bottom pattern is not just a shape — it’s a reflection of crowd psychology, a tug-of-war between fear and optimism. When used wisely with confirmation and risk management, it becomes a powerful weapon in a trader’s arsenal.
Focus on higher timeframes, wait for volume breakout, and stay disciplined — and this pattern can lead you to consistent wins.