The Secret Language of Stochastic
In the chaotic dance of the market, every candlestick is a footprint. But beneath this chaos lies a current—an invisible wave. The stochastic oscillator is the compass that reveals whether the market is tired or thirsty for more.
This isn’t about overbought or oversold.
This is about energy.
- When %K and %D lines cross in the oversold region (below 20), they are not just lines—they are whispers of awakening bulls, stirring in the deep.
- When they cross in the overbought region (above 80), they are not immediate sell signals. They are echoes, telling you the market is testing greed.
Watch closely:
A rising stochastic with falling price signals underground accumulation—the smart money loading silently.
A flat stochastic while price climbs hints at fake strength.

🔮 The Triple Confluence Ritual
This ancient technique used by few:
- Stochastic Cross: Below 20 or above 80.
- Price Candle Confirmation: A pin bar or engulfing candle appears.
- Volume Pulse: An unusual surge—like a heartbeat skipping.
When all three align—you don’t chase the market, it reveals itself to you.
🧘 The Zen of Waiting
The market speaks loudest when you stop screaming.
Let the stochastic curl up like a cobra in silence. The tighter the curl, the sharper the strike.
Many enter too early. But the mystic waits for the curl, the cross, and the candle. That’s the triple whisper—and when you follow it, the market flows to you.

Final Whisper
“The stochastic oscillator doesn’t predict the future. It listens to the heartbeat of the present.”
Read it not as a trader.
Read it as a codebreaker of the market’s deeper intent.
🌒 Stochastic: The Market’s Breath
The market breathes in waves, and the stochastic oscillator catches each inhale and exhale.
Here’s how you can use it easily—not just as a trader, but as a reader of energy:
🪞1. Overbought & Oversold – But With a Twist
- Above 80 = Overbought → But wait! This doesn’t always mean “sell”.
- If the stochastic stays above 80 for long—it shows strong bullish energy.
- Below 20 = Oversold → Again, don’t rush to buy.
- A stochastic that lingers below 20 may signal strong bearish continuation.
💡 Pro Tip: Watch for crosses at these levels. A %K crossing %D upward below 20 is your “first heartbeat” to prepare for a buy.
Same way, a downward cross above 80 is your “cooling wind” before a possible sell.
🧙♂️2. Follow the Stochastic Bounce
Use Dynamic Zones:
- Draw horizontal lines at 20 and 80.
- Whenever price touches 20 and stochastic bounces—you are at the edge of exhaustion.
- If stochastic bounces twice at 20 = Double confirmation of market tiredness.
🌿 This is the “bounce of reversal.”
🪜3. The Ladder Pattern (Advanced Simplicity)
- Watch for three waves in stochastic:
- First cross
- Pullback without breaking below/above 20/80
- Second cross = ✅ Confirmation move
It looks like a ladder being climbed.
This structure appears before powerful breakouts.
🔁4. Divergence Detection – Hidden Signal
- If price is making new highs, but stochastic is not → This is bearish divergence (smart exit zone).
- If price is making lower lows, but stochastic isn’t → Bullish divergence (smart entry signal).
It’s like hearing a lie through a smile.
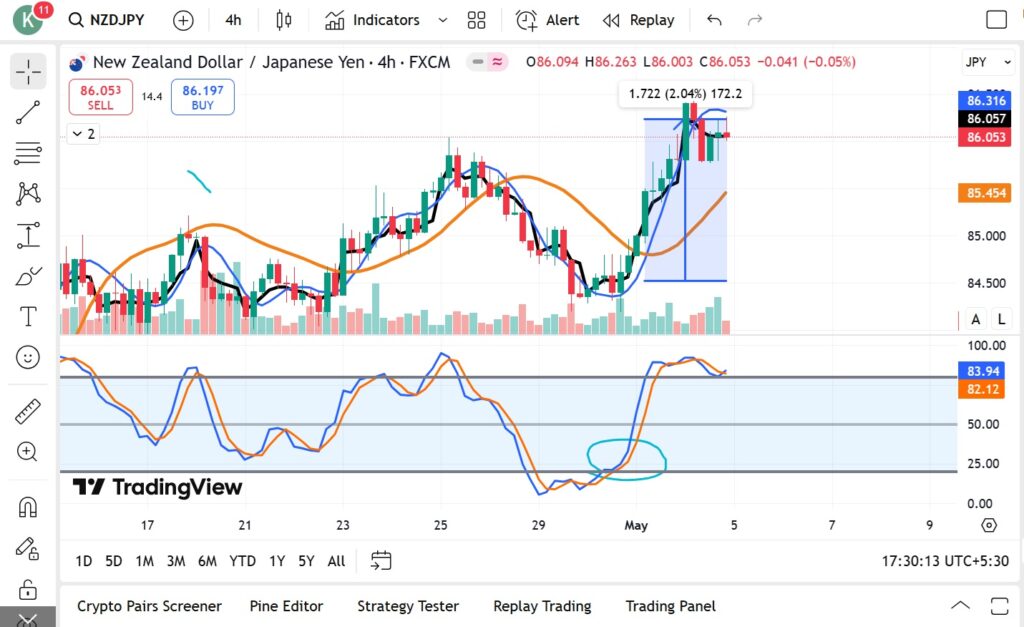
🔥5. Combine With Moving Averages
- Use a simple 50 EMA (Exponential Moving Average).
- If stochastic gives a buy signal (crosses upward at 20), and price is above 50 EMA → this is a golden alignment.
- Same logic in reverse for sells.
⚡ This adds a trend filter to your stochastic entries.
🧘♀️6. The One-Candle Rule
After the stochastic cross:
This reduces fake signals and gives you psychological calm before entering.
Wait for 1 confirmation candle (a strong bullish or bearish candle).