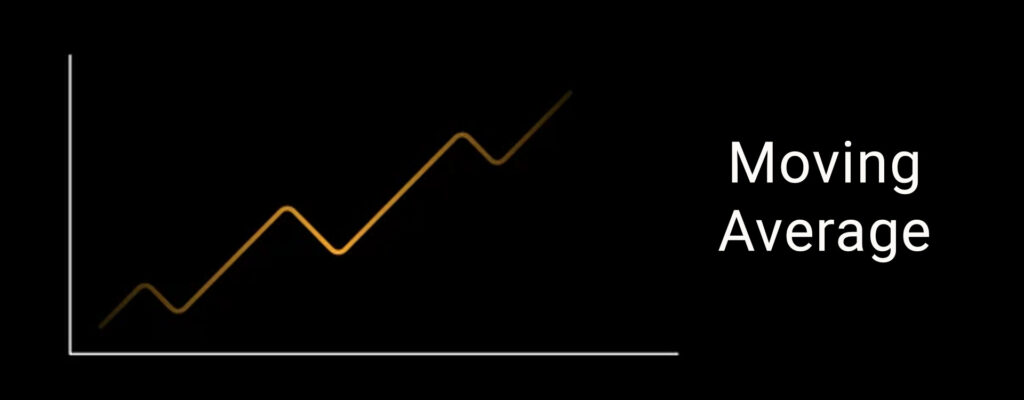
Step into the world of technical analysis, and you’ll soon meet the moving average — the market’s time-tested compass. It’s simple, beautiful, and wildly powerful. From Wall Street legends to algorithmic quants, everyone uses it, and for good reason: the moving average doesn’t just follow price — it reveals its soul.
In this guide, we dive deep into how to use moving averages (MAs) effectively across different timeframes, with the best periods, combinations, supporting indicators, and even a bit of market legacy.
📈 Mastering Moving Averages: The Trader’s Timeless Tool
Moving Averages (MAs) are the bedrock of technical analysis, offering traders a lens to view market trends with clarity. Whether you’re a novice or a seasoned trader, understanding MAs can significantly enhance your trading strategy.
🧠 Understanding Moving Averages
At its core, a Moving Average smooths out price data to identify the direction of a trend. There are two primary types:
- Simple Moving Average (SMA): Calculates the average of a selected range of prices, usually closing prices, by the number of periods in that range.
- Exponential Moving Average (EMA): Similar to SMA but gives more weight to recent prices, making it more responsive to new information.
⏱️ Optimal Moving Average Periods Across Timeframes
Selecting the right MA period is crucial and often depends on your trading timeframe:
🟩 Short-Term Trading (Intraday: 1m to 15m)
- 5 EMA: Captures immediate price movements.
- 9 EMA: Balances responsiveness and noise reduction.
- 20 SMA: Identifies short-term trends.
🟨 Swing Trading (1H to 4H)
- 20 EMA: Tracks short-term momentum.
- 50 SMA: Highlights medium-term trend direction.
- 100 SMA: Offers broader trend perspective.
🟦 Long-Term Trading (Daily to Weekly)
- 50 SMA: Indicates intermediate trend.
- 100 SMA: Reflects long-term trend strength.
- 200 SMA: Serves as a significant support/resistance level and trend indicator.
🔁 Powerful Moving Average Combinations
1. Golden Cross & Death Cross
- Golden Cross: 50 SMA crosses above 200 SMA, signaling a bullish trend.
- Death Cross: 50 SMA crosses below 200 SMA, indicating a bearish trend.
2. 9 EMA & 21 EMA Crossover
- Bullish Signal: 9 EMA crosses above 21 EMA.
- Bearish Signal: 9 EMA crosses below 21 EMA.
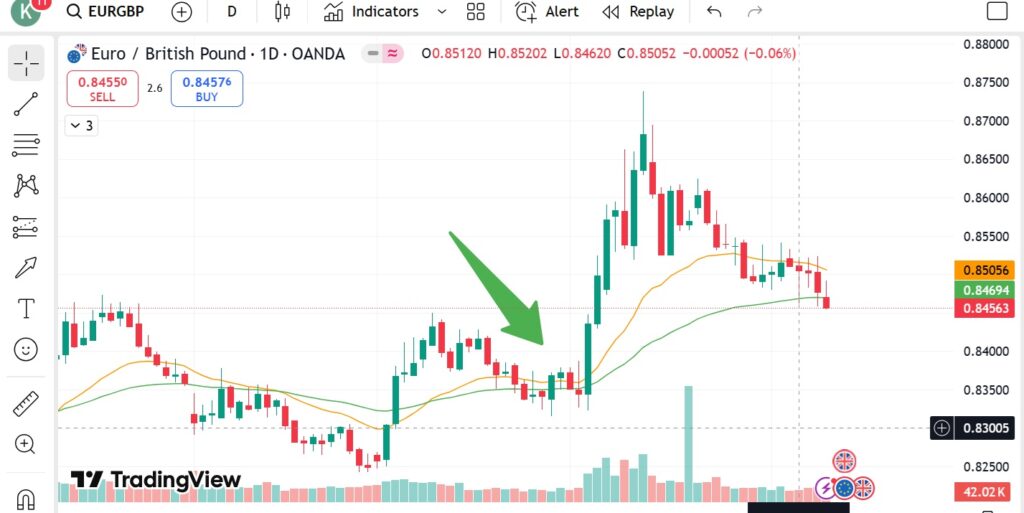
3. 20 EMA & Price Action
- Price bouncing off the 20 EMA can indicate trend continuation.
- Price breaking through the 20 EMA may signal a trend reversal.
🛠️ Enhancing MAs with Supporting Indicators
Combining MAs with other indicators can improve signal accuracy:
Volume Indicators: Confirm the strength of price movements.
MACD (Moving Average Convergence Divergence): Helps identify changes in momentum and trend direction.
RSI (Relative Strength Index): Measures the speed and change of price movements, indicating overbought or oversold conditions.
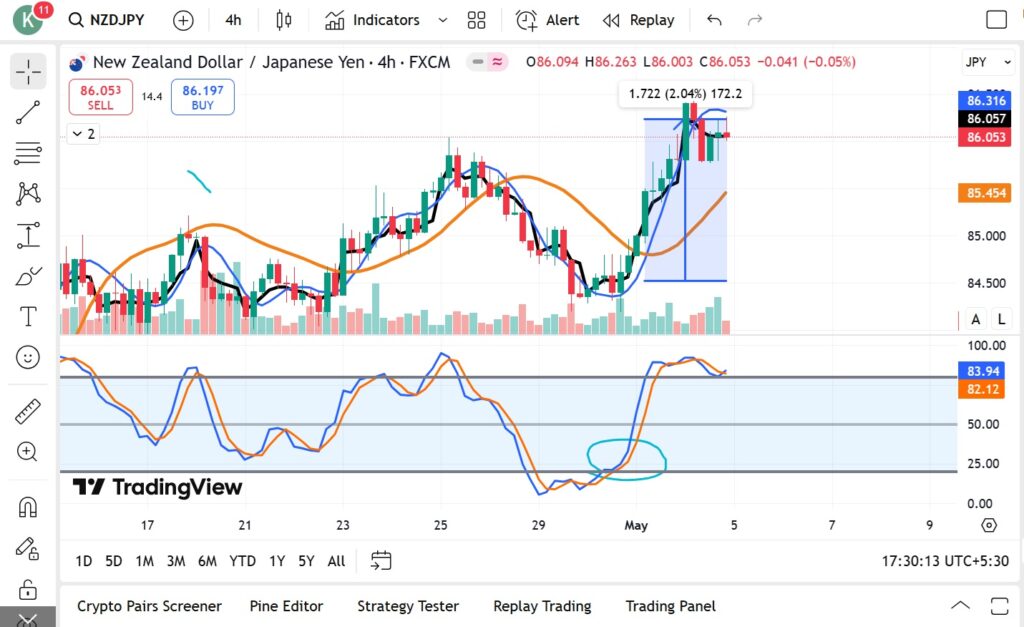
📚 What is a Moving Average actually ?
A moving average is simply the average price over a specific number of periods, plotted as a line on your chart.
Think of it as a trend smoother: it cuts through the market noise and shows you the true direction price is flowing in.
🧮 Two Most Popular Types:
- SMA (Simple Moving Average): Equal weight to all periods.
- EMA (Exponential Moving Average): More weight to recent prices (faster response).
🏛️ A Bit of Legacy: Why Traders Worship MAs
Moving averages have stood the test of time — from Jesse Livermore‘s trend-following instincts to Richard Dennis and the Turtle Traders, who rode trends using basic moving averages and made fortunes.
They remain the foundation of most trading systems — from manual price action to automated algorithms.

📊 SMA vs EMA: Which Moving Average Should You Use?
In the world of trading, moving averages are like compasses — they help you navigate the market’s ups and downs. But not all moving averages are created equal. The Simple Moving Average (SMA) and the Exponential Moving Average (EMA) are the two most popular, and each has its strengths.
Let’s explore the key differences, when to use each, and which one might suit your style best.
🧮 What’s the Difference?
| Feature | SMA | EMA |
|---|---|---|
| Full Name | Simple Moving Average | Exponential Moving Average |
| Calculation | Average of all prices over N periods | Weighted average that favors recent prices |
| Responsiveness | Slower, more stable | Faster, reacts quickly to price changes |
| Smoothing | Equal weight to each data point | Heavier weight to recent data |
| Lag | More lag due to equal weighting | Less lag, more sensitive |
| Use Case | Good for long-term trends & filters | Ideal for short-term signals & entries |
📘 Example:
For a 10-period moving average:
- SMA = (P1 + P2 + P3 + … + P10) / 10
- EMA = More weight on P10, less on P1 — so it tracks price more closely
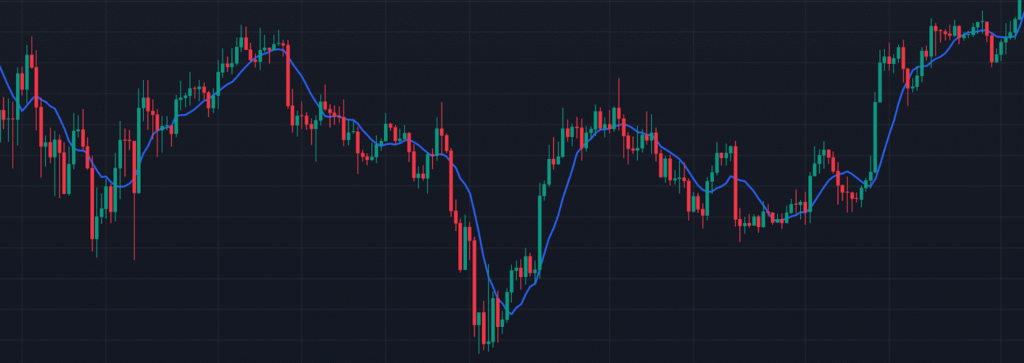
📈 Visual Difference (Imagine a Chart)
- SMA line looks smooth and steady — it filters noise.
- EMA line hugs the price more tightly — it catches moves faster.
🕵️♂️ When to Use SMA
✅ Use SMA when:
- You want to filter out noise.
- You’re trading longer-term trends.
- You want a more stable signal for confirmation.
🔍 Best For:
- Swing traders, position traders, investors.
- Tools like 200 SMA, 50 SMA are institutional favorites.
⚡ When to Use EMA
✅ Use EMA when:
- You want to react quickly to market changes.
- You’re trading short-term or using fast momentum setups.
- You’re looking for early signals and tighter entries.
🔍 Best For:
- Day traders, scalpers, short-term swing traders.
- Popular EMAs: 9, 10, 20, 21 EMA

🧠 Pro Tip: Combine Them
You don’t have to pick one — many traders combine both:
- Example Combo: 9 EMA (fast entry) + 50 SMA (trend filter)
- If price is above 50 SMA → bullish bias
- If 9 EMA crosses above 21 EMA → entry trigger
This combo gives you both trend confirmation and fast signals.
🧪 Summary: EMA vs SMA Cheat Sheet
| You Want… | Go With… | Why |
|---|---|---|
| Stable, long-term trend filter | SMA | Smooths price, less whipsaw |
| Fast signals, quick reactions | EMA | Catches price moves early |
| Noise reduction in sideways market | SMA | Less reactive, more reliable |
| Fast momentum trades | EMA | Reacts quicker to sharp moves |
| A blend of both worlds | Combine them | Get confirmation + reactivity in one setup |
📣 Final Verdict
- SMA = Better for trend analysis & long-term clarity.
- EMA = Better for entries & short-term precision.
Both are powerful. The key is to match the tool to your strategy.
⏱️ The Best Moving Average Periods for Each Timeframe
Different timeframes = different personalities. Here’s how to choose your MA periods wisely:
🟩 Scalping / Day Trading (1m to 15m)
Use fast MAs to react quickly.
| Purpose | MA Type | Period |
|---|---|---|
| Entry trigger | EMA | 9 or 10 |
| Trend guide | EMA/SMA | 20 |
| Dynamic S/R | SMA | 50 |
🟨 Swing Trading (1H to 4H)
Balanced between speed and reliability.
| Purpose | MA Type | Period |
|---|---|---|
| Entry signal | EMA | 20 |
| Trend filter | SMA | 50 |
| Macro context | SMA | 100 or 200 |
🟦 Position Trading / Investing (Daily/Weekly)
Longer MAs = deeper insights.
| Purpose | MA Type | Period |
|---|---|---|
| Entry zone | EMA | 21 |
| Trend guide | SMA | 50 |
| Legacy MA | SMA | 200 (widely used by institutions) |
🔁 Classic MA Combinations That Just Work
1. Golden Cross & Death Cross
- 50 SMA crossing above 200 SMA = Golden Cross (bullish)
- 50 SMA crossing below 200 SMA = Death Cross (bearish)
Legendary signals. Used by hedge funds, banks, and old-school traders.
2. 9 EMA + 21 EMA (Momentum Combo)
- Perfect for day and swing trading.
- Bullish crossover = trend igniting.
- Bearish crossover = trend weakening.
Add MACD for confirmation, and you’ve got a sniper setup.
3. 20 EMA + Price Action
- Powerful dynamic support/resistance.
- Price bouncing off 20 EMA = strength.
- Price slicing through 20 EMA = potential trend shift.
4. 10 EMA + 50 SMA (Turbo Trend Filter)
- 10 EMA rides fast trends.
- 50 SMA confirms direction.
- If both point the same way → stay in the trend.
🛠️ Supporting Indicators That Pair Beautifully with MAs
✅ MACD
- Confirms trend direction and momentum.
- Use MACD crossovers with MA pullbacks.
✅ RSI
- Measures strength of a move.
- Use RSI divergence when price is extended from MAs.
✅ Volume / OBV
- Moving average + increasing volume = strong conviction.
- Price breaking MA with low volume? Be cautious.
✅ Bollinger Bands
- Built around 20 SMA.
- Combine with MAs to identify volatility squeezes.
🚀 Pro Tips to Master MAs Like a Market Jedi
- Use MA as a “Zone”, not a line.
Price will often “respect” an area around the MA, not the exact line. - Higher timeframes dominate.
A 200 SMA on daily is more powerful than a 20 EMA on 15min. - Don’t blindly buy/sell crossovers.
Confirm with price structure, candlestick patterns, or momentum. - Watch MA slope.
A rising MA is more important than a crossover on a flat MA. - The 200 SMA is sacred.
When price breaks and holds above or below it, the market often makes major moves.
🧠 Final Thought: MAs Are Not Magic — They’re Maps
Moving averages won’t predict the future. But they will tell you where you are in the market cycle:
- Are we trending or ranging?
- Are bulls in control, or bears?
- Should I look for pullbacks or reversals?
Once you learn to read them, you stop reacting and start anticipating.
💎 Summary: Moving Average Toolkit
| Tool | Use Case |
|---|---|
| 9/10 EMA | Entry trigger, short-term trend |
| 20 EMA/SMA | Dynamic S/R, trend pullbacks |
| 50 SMA | Medium-term trend filter |
| 100/200 SMA | Long-term trend direction |
| EMA + MACD | Momentum confirmation |
| MA Crossovers | Entry signals, trend reversals |
| MA + RSI Divergence | Reversal setup |
⚡