
The Keltner Channel is a dynamic volatility-based envelope that uses an EMA and ATR to identify trends, breakouts, and overbought/oversold conditions with precision.
In the world of technical analysis, some tools scream for attention — Bollinger Bands, RSI, MACD. But one quietly powerful indicator has stayed just under the radar: the Keltner Channel.
It’s the secret weapon of disciplined trend followers and volatility hunters. Once you understand how it works, you’ll wonder how you ever traded without it.
🔍 What is the Keltner Channel?
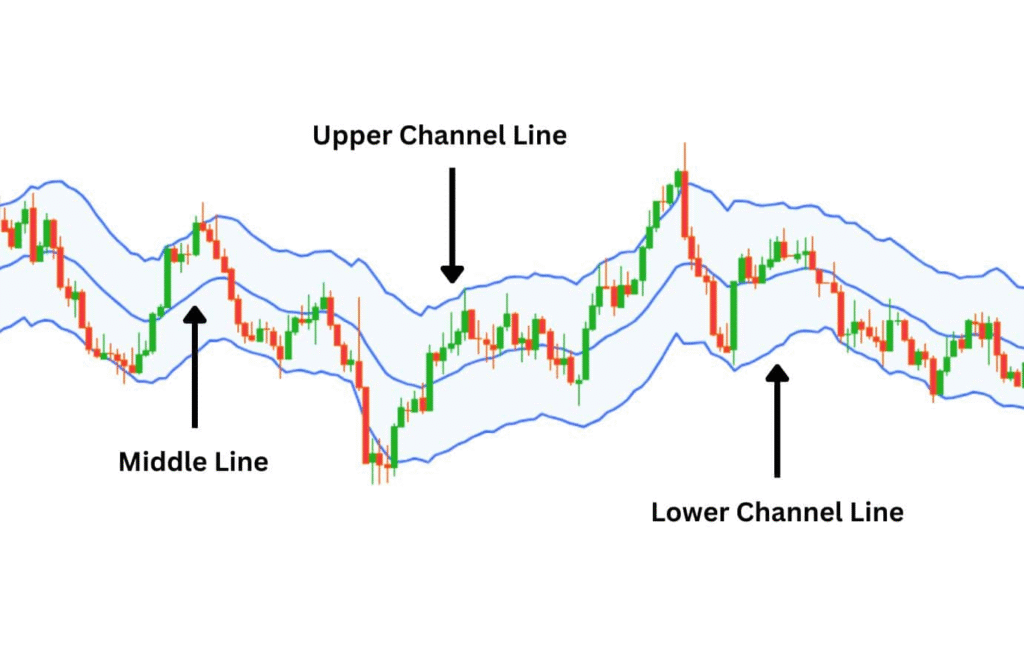
The Keltner Channel (KC) is a volatility-based envelope that plots a central moving average with upper and lower bands set at a multiple of the Average True Range (ATR).
🧠 Formula Breakdown:
- Middle Line = Exponential Moving Average (typically 20-period EMA)
- Upper Band = EMA + (ATR × multiplier)
- Lower Band = EMA − (ATR × multiplier)
🧪 Default Multiplier: Usually 2x ATR, but adjustable based on volatility and strategy.
So unlike Bollinger Bands (which use standard deviation), Keltner Channels respond to actual price movement ranges, making them more stable and trend-friendly.
⚙️ Key Settings for Keltner Channel
| Timeframe | EMA Period | ATR Period | Multiplier |
|---|---|---|---|
| 1-min to 15-min | 20 | 10 | 1.5–2 |
| 1H to 4H | 20 | 10 | 2 |
| Daily/Weekly | 20 | 10 | 2.5 |
You can tweak the multiplier to fit your trading style:
- Smaller = tighter bands (more signals)
- Larger = wider bands (fewer but stronger signals)
🚀 How to Trade with the Keltner Channel
1. Trend Following: Ride the Band
- Bullish Trend: Price hugs or rides the upper band.
- Bearish Trend: Price consistently tests or breaks below the lower band.
💡 Entry Tip: Enter on pullbacks to the middle EMA during a strong trend.
📌 Best Timeframes: 15-min, 1H, Daily
2. Breakout Strategy: When Price Escapes the Cage
When price breaks out of the upper or lower band with volume and momentum, it often signals the start of a new trend.
🚨 How to Trade:
- Wait for a strong close outside the band.
- Confirm with MACD or RSI.
- Enter in breakout direction.
- Target: 1.5x ATR or until price returns to the midline.
📌 Best Timeframes: 1H, 4H, Daily
3. Reversion to Mean: Fade the Extremes
In range-bound markets, price tends to revert to the center line after touching the outer bands.
🧭 Entry Plan:
- Watch for rejection candles (e.g., pin bars) on outer bands.
- Use RSI overbought/oversold or MACD divergence to confirm.
- Target: EMA (center line)
📌 Best Timeframes: 5-min to 1H
4. Squeeze Setup: KC + Bollinger Bands
Combine Keltner Channel + Bollinger Bands to detect volatility squeezes before big moves.
🔍 What to Look For:
- When Bollinger Bands move inside the Keltner Channel, it signals low volatility.
- The tighter the squeeze, the bigger the potential breakout.
🎯 Once price breaks out of the bands → enter in direction of breakout with confirmation.
📌 Best Timeframes: 15-min, 1H
🧰 Best Supporting Indicators for Keltner Channel
✅ MACD
- Confirms trend direction during breakouts or rides along the band.
- Use MACD histogram momentum to filter false signals.
✅ RSI
- Spot overbought/oversold conditions near outer bands.
- Look for divergence when price stretches far beyond bands.
✅ Volume (OBV or Volume Profile)
- Increased volume confirms breakout validity.
- Low volume = likely fake-out.
✅ Price Action
- Candlestick patterns on outer bands (e.g., engulfing, pin bar) offer strong signals.
- Break + retest structures work beautifully with KC midline.
🧠 Pro Tips for Mastery
- Don’t trade every touch of the band — context matters. Confirm with trend, volume, or confluence.
- Use higher timeframe KC as a trend filter and lower timeframe for entries.
- Watch the slope of the EMA — up = bullish, down = bearish.
- Combine with a 20 or 50 EMA to filter fakeouts and find trend confluence.
📋 Summary Cheat Sheet
| Signal Type | Location | Entry Signal | Confirmation Tool |
|---|---|---|---|
| Trend Riding | Outer band (with slope) | Pullback to EMA | MACD or price action |
| Breakout Strategy | Clean break of band | Candle close outside band | Volume + RSI |
| Reversion Trade | Touch of outer band | Rejection candle + RSI divergence | MACD/RSI |
| Squeeze Setup | Bollinger inside KC | Band expansion + candle breakout | Volume spike |
🎯 Bonus Strategies
✅ 1. Trend Trading
- When price stays near the upper band, trend is up. Look for buy on pullbacks to the middle line (EMA).
- When price stays near the lower band, trend is down. Look for sell on pullbacks to the middle line.
- Ignore sideways price — trend must be clear.
✅ 2. Breakout Trading
- If price moves outside the upper or lower band with strong candles and volume, it often starts a new trend.
- Buy when price closes above the upper band.
- Sell when price closes below the lower band.
- Use stop-loss just inside the channel.
✅ 3. Mean Reversion (Fade the Edges)
- In sideways markets, price hits the upper band and comes back down. You can sell there.
- When it hits the lower band and bounces up, you can buy.
- Exit at the middle line (EMA).
- Only use this if there’s no trend.
✅ 4. Pullback Entries
- In an uptrend, wait for price to pull back to the middle EMA, then buy the bounce.
- In a downtrend, wait for price to pull back to the EMA, then sell the rejection.
- This gives better entries with lower risk.
✅ 5. Volatility Squeeze (Keltner + Bollinger)
- When Bollinger Bands go inside Keltner Channel, it means low volatility (price is “squeezing”).
- When price breaks out after that, a big move is coming.
- Trade in the direction of the breakout candle.
- Confirm with volume or MACD.
✅ Timeframes:
Daily: For longer swing or position trades.
1m to 15m: For scalping and quick trades.
1H to 4H: For intraday or swing trades.
Here’s a simple and effective Keltner Channel strategy template, ideal for intraday and swing trading (works best on 15min, 1H, or 4H timeframes). You can apply this directly in TradingView or your charting platform.
🔹 Keltner Channel Trend-Pullback Strategy Template
🛠️ Indicator Settings:
- Keltner Channel
- EMA Period:
20 - ATR Period:
10 - Multiplier:
2
- EMA Period:
- Confirming Indicators(optional but recommended):
- RSI (14)
- MACD or Volume
🟩 Buy Setup (Bullish):
- Price is above the middle EMA line (trend is up).
- Price pulls back to the middle line (or slightly below).
- Wait for a bullish candle (e.g., pin bar, engulfing) to form at or near the EMA.
- Confirm with:
- RSI is above 50 and rising.
- MACD line is above signal line or histogram is positive.
✅ Enter Long at close of confirmation candle.
📍 Stop-loss: Just below the recent swing low or lower Keltner band.
🎯 Target: Upper band or use 1.5x risk as reward.
🟥 Sell Setup (Bearish):
- Price is below the middle EMA line (trend is down).
- Price pulls back to the middle line (or slightly above).
- Wait for a bearish candle to form near the EMA.
- Confirm with:
- RSI is below 50 and falling.
- MACD line is below signal line or histogram is negative.
✅ Enter Short at close of confirmation candle.
📍 Stop-loss: Just above recent swing high or upper band.
🎯 Target: Lower band or 1.5x your risk.